Almost every “LLM on your phone” writeup runs a 1B to 4B model on a current flagship, reports tokens per second over the first few seconds, and stops. That is the easy quarter of the problem. The hard part is an 8B model on a phone that cost 250 dollars, over a generation long enough to matter, with an operating system free to kill your process whenever memory gets tight.
The numbers below come off a Snapdragon 695: two Cortex-A78 cores at 2.2 GHz,
six Cortex-A55 at 1.8 GHz, LPDDR4X-2133 on a 32-bit bus, UFS 2.2 storage, 8 GB
of RAM. It is a boring 2022 mid-range part, and it is roughly what a large share
of Android users are holding. Everything is llama-bench and llama-cli from a
recent llama.cpp on Meta-Llama-3.1-8B-Instruct, threads pinned, phone at room
temperature unless the text says otherwise.
Three ceilings decide whether this is possible, and they bind in an order that surprised me. Bandwidth sets the token rate before you write a line of inference code. Residency, meaning whether the weights stay in RAM, decides whether that rate is what you get or a factor of five below it. Heat takes about 40% of whatever survives, starting around twenty-five seconds in.
Where this runs
Strip away the app and everything below competes for the same 8 GB and the same memory bus. The split inside the weights box is the one that ends up mattering most, but it is not visible from any API.
flowchart TD
  U[User taps send] --> APP[App / UI thread]
  APP --> RT{{llama.cpp context<br/>pinned thread pool}}
  RT --> W[Model weights]
  W --> MM[mmap'd, file-backed<br/>clean, evictable]
  W --> RP[repacked Q4_K tensors<br/>malloc'd, dirty]
  RT --> KV[KV cache<br/>anonymous, dirty]
  RT --> BK[Compute backend]
  BK --> CPU[CPU: NEON + dotprod]
  BK --> GPU[GPU: Vulkan / OpenCL]
  MM --- FLASH[(UFS flash: GGUF file)]
  style MM fill:#0f766e22,stroke:#0f766e,stroke-width:2px
  style RP fill:#dc262622,stroke:#dc2626,stroke-width:2px
  style KV fill:#f59e0b22,stroke:#b45309
The runtime is yours. Everything under the backend box belongs to the device vendor. The three coloured boxes are the three kinds of memory the kernel treats differently, and the differences between them decide what fails and how.
Decode reads every weight once, so bandwidth sets the ceiling
Generating one token at a time for one user, each decoded token reads every weight once and does a couple of arithmetic operations per byte. That is far to the left of the roofline ridge, so the token rate is whatever the chip can pull across the memory bus divided by the size of the model:
The denominator is fixed by the file, but the numerator is not a property of the chip. It depends on how many cores are running and which ones, so it is partly yours.
Here is the thread sweep for the 8B at Q4_0, 4.65 GB of weights, with the thread pool pinned so the placement is not up to the scheduler.
-t | pinned to | pp512 | tg128 | implied read rate |
|---|---|---|---|---|
| 2 | 2x A78 | 8.1 | 2.0 | 9.3 GB/s |
| 4 | 2x A78 + 2x A55 | 11.4 | 2.1 | 9.8 GB/s |
| 6 | 2x A78 + 4x A55 | 13.6 | 1.8 | 8.4 GB/s |
| 8 | all eight | 12.2 | 1.5 | 7.0 GB/s |
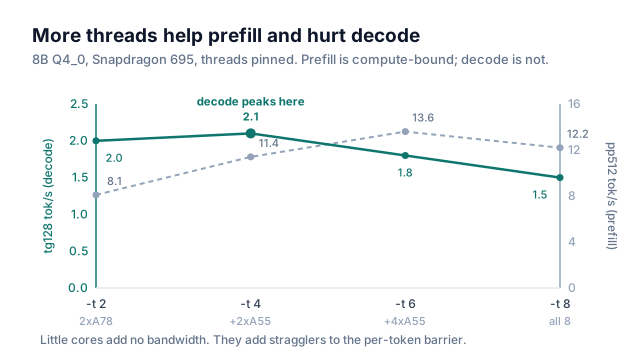
Prefill and decode disagree about how many threads is right, and the reason they disagree is the thing to internalise. Prefill is a batched matmul, it is compute-bound, and it scales with cores until oversubscription starts costing more than the sixth core earns. Decode peaks at four and then goes backwards.
The usual reconciliation says decode is bandwidth-bound so extra cores stop helping. If that were the whole story the extra cores would be harmless and the curve would flatten. The curve falls.
Peak LPDDR4X-2133 on a 32-bit bus is 17.1 GB/s, and the best row above reaches 9.8, which is 57% of it. Getting even that far requires enough outstanding loads in flight to keep the memory controller busy. An A55 is an in-order core with a much shallower load queue. It adds a small fraction of what an A78 adds to the outstanding-load count, and it adds a full participant to the barrier at the end of every layer, which makes the token time the slowest thread’s token time. Two are worth the trade. Four aren’t.
Hold onto the mechanism, because the thermal section reuses it. Achieved bandwidth is not a constant of the chip, so anything that removes A78 load queues, or slows the DRAM those queues are loading from, lowers the ceiling itself instead of moving you further beneath it.
Pin explicitly. llama.cpp will happily let the scheduler put your two “big” threads on little cores, and a run that lands that way looks like a 30% regression with no cause. The threadpool takes a core mask:
#include "ggml-cpu.h"
#include "llama.h"

// SD695 topology: cpu0-5 are Cortex-A55, cpu6-7 are Cortex-A78.
// Big cluster plus two little cores was the decode optimum on this part.
static ggml_threadpool * make_pinned_pool(int n_threads, const int * cpus) {
    ggml_threadpool_params tp = ggml_threadpool_params_default(n_threads);
    for (int i = 0; i < n_threads; ++i) {
        tp.cpumask[cpus[i]] = true;
    }
    tp.strict_cpu = true;                 // one thread per masked core, no migration
    tp.prio       = GGML_SCHED_PRIO_HIGH; // loses to the UI thread, beats background work
    tp.poll       = 50;                   // spin before sleeping; wakeups cost more than idle here
    return ggml_threadpool_new(&tp);
}

const int decode_cpus[4] = { 6, 7, 4, 5 };
ggml_threadpool * pool = make_pinned_pool(4, decode_cpus);
llama_attach_threadpool(ctx, pool, pool);   // same pool for decode and batch
strict_cpu is the flag that matters. Without it the mask is only a hint, and the
scheduler can still migrate a worker onto a little core mid-generation. That is
exactly the run-to-run variance I spent two days chasing before I read the struct.
The memory budget, and the moment the weights stop being a file
Whether the model runs at that rate is a separate question from whether it loads, and this is where the arithmetic stops being friendly. Footprint has two parts:
P is parameter count, b_w bytes per weight, L the sequence length so far,
and the 2 is for keys and values. People remember the first term. For a
Llama-class 8B with 32 layers, 8 key/value heads after
grouped-query attention, and head dimension
128, the second term at fp16 is:
def kv_bytes_per_token(n_layers, n_kv_heads, d_head, bytes_per_elem):
    return 2 * n_layers * n_kv_heads * d_head * bytes_per_elem

print(kv_bytes_per_token(32, 8, 128, 2) / 1024)   # -> 128.0 KiB per token
A 4096-token context is 512 MiB and an 8192-token conversation is a full gigabyte. Grouped-query attention is the only reason this is survivable at all. With 32 key/value heads the same context costs four times as much.
| KV config | per token | 4k context | 8k context |
|---|---|---|---|
| MHA, fp16 (32 kv heads) | 512 KiB | 2.0 GiB | 4.0 GiB |
| GQA, fp16 (8 kv heads) | 128 KiB | 512 MiB | 1.0 GiB |
| GQA, q8_0 (8 kv heads) | 68 KiB | 272 MiB | 544 MiB |
| GQA, q4_0 (8 kv heads) | 36 KiB | 144 MiB | 288 MiB |
The quantized rows are 68 and 36 rather than 64 and 32 because q8_0 and q4_0
carry an fp16 scale per 32 elements, so they cost 8.5 and 4.5 bits per value. It
is a small correction, but it is the kind that makes a capacity plan wrong by
exactly enough to matter at the boundary.
Now stack it against the device. An 8 GB phone does not offer 8 GB. Android and the kernel hold a couple of gigabytes, and the apps kept warm for fast resume hold another.
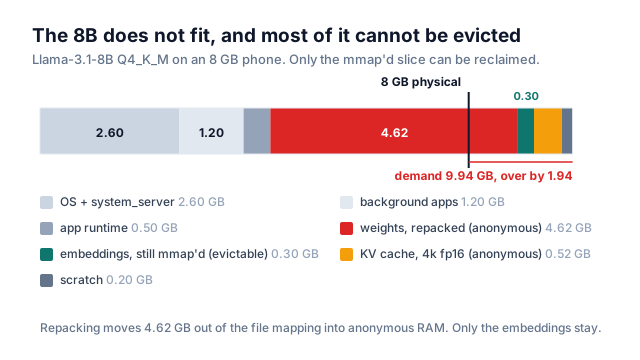
The total is 9.94 GB against 8 GB of physical memory. That much is unsurprising. The part that took me a quarter to notice is the split inside the weights.
The usual argument for memory-mapping the GGUF is that weights become clean file-backed pages: the kernel can drop them under pressure and read them back from flash, so they don’t count against you the way an allocation does. The argument is correct, but on this configuration it applies to less than a third of the weights.
llama.cpp repacks quantized weights into an interleaved layout so the ARM
kernels can run a wide GEMV without shuffling on every block. The repacked
tensors are handed to an extra buffer type, and the model loader only uses the
mmap-backed buffer for the default buffer type. Everything assigned to the extra
buffer type is allocated with malloc and copied.
Which types get repacked is the part that moves under you, and it moved while I
was writing this. On a NEON chip with dotprod it is now Q4_0, Q4_K, Q5_K,
Q6_K, Q8_0, IQ4_NL and MXFP4; Q5_K and Q6_K arrived within the last
few months. Q3_K has no entry at all, and Q2_K’s is gated on AVX-512, so on
ARM it hasn’t got one either. Pin a commit before you quote any of this.
For an 8B Q4_K_M that leaves almost nothing in the file mapping. 4.62 GB of the
4.92 becomes anonymous dirty pages the moment the model finishes loading. The
0.30 GB that stays file-backed is the token embedding table, and it stays only
because it is read with GET_ROWS rather than a matmul, so no repacked kernel
wants it.
Choosing the format for quality also chose the kernel, and choosing the kernel silently chose which of your weights the kernel can reclaim. Three different layers, none of which mention the other two in their docs.
Two ways to run out of memory
Because of that split, an oversized model has two entirely different failure modes, and which one you get depends on which format you picked.
If the weights are still file-backed, you thrash. The model loads, because mmap defers every read, and the first response comes back at a plausible speed. Then the resident set exceeds what the device will give you, and each decode step faults back in the pages the previous step evicted. Every weight is read once per token by definition, so the whole file has to be resident or a fraction of it comes off UFS at 800 MB/s instead of out of DRAM at 9.8 GB/s. Nothing crashes. The token rate falls by a factor of five and stays there.
If the weights were repacked into anonymous memory, there is nothing to evict,
so the kernel goes looking for a process to kill and finds you. Modern Android
does this from userspace, and the line in logcat looks like this:
lmkd: Kill 'com.example.app' (24815), uid 10214, oom_score_adj 0 to free 4692184kB
  rss, 0kB swap; reason: low watermark is breached and thrashing (77%)
oom_score_adj 0 means lmkd killed a visible foreground app, which it does only
when it has run out of cheaper options. The reason string is the more useful
half. It names a thrash percentage because the kill and the thrash are one event:
lmkd watches workingset_refault_file and fires when refaults grow past a
threshold while a watermark is breached. Your process is being killed for reading
its own weights too often.
A single flag selects which of the two you get, and I didn’t find it until after
I had written most of this. llama_model_params carries a use_extra_bufts bool
defaulting to true; the CLI spells the same switch --repack and -nr, --no-repack. Turn it off and the loader assembles its CPU buffer list with no
extra buffer types in it, so every tensor lands on the default one, which is the
only buffer type the loader is allowed to back with the file mapping. Nothing is
copied at load. All 4.92 GB stays clean and file-backed, and the process stops
being the fattest unevictable thing on the device.
What it costs is the kernel. With no repacked layout to run against, Q4_K falls
through to the same generic per-block path Q3_K uses, and the format table in
the next section measures what that path costs on this chip. So the flag isn’t a
memory-for-speed trade in the ordinary sense. It picks a failure: on, an oversized
model is fast and gets killed at load; off, the same model survives, holds
whatever fraction of itself the kernel will keep, and decodes at flash speed. On
an 8 GB phone with an 8B neither branch is a product, but it is still the first
experiment to run, and it costs one command-line argument.
The KV cache is what pushes either failure over the line, and it arrives earlier
than the folk model says. The folk model is that the cache accretes token by token
until it crosses a line somewhere around turn five. It doesn’t. llama.cpp
allocates the whole n_ctx worth of K and V tensors when you create the context
and then clears the buffer, and that memset first-touches every page, so the cache
is fully resident before you have decoded a single token.
Take the waterfall’s own numbers and add up only the parts the kernel cannot reclaim. The OS holds 2.60 GB, background apps 1.20, the app runtime 0.50, the repacked weights 4.62 and scratch 0.20. That is 9.12 GB of unevictable demand against 8 GB of physical RAM, and the KV cache has not been allocated yet. A 4,096-token fp16 cache at 128 KiB per token adds 0.52 on top of that, and quantizing it to q8_0 at 68 KiB per token adds 0.27.
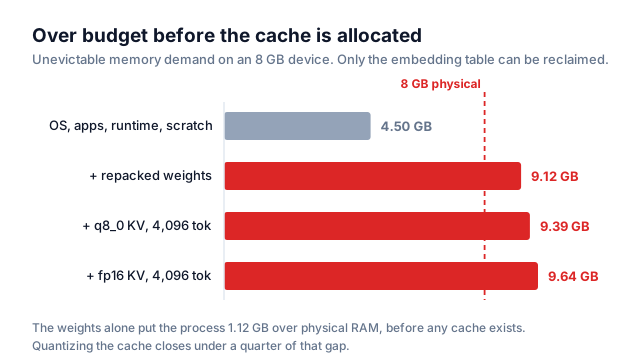
Cache quantization is worth doing, but it is not the lever here. The gap is 1.12 GB before the cache exists, so halving a 0.52 GB cache closes less than a quarter of it.
So there is no crossing point to find. The reservation either fits at
llama_init_from_model or it doesn’t, and on this device it doesn’t.
What makes the kill feel random is a different mechanism. The allocation succeeds on a quiet phone, because the kernel is happy to overcommit and the pages are only touched as the clear runs. Then a background app returns, lmkd goes looking for the fattest unevictable resident set, and yours is the largest thing on the device by a wide margin. The timing is set by whatever else the user does, which is why it correlates with nothing you control.
The fix is to make the failure happen at startup where you can show a message. Cap the context deliberately and quantize the cache, then check the numbers before you build the context rather than discovering them from a kill. There is a coupling in the quantization that costs an afternoon if you do not know about it:
llama_context_params cp = llama_context_default_params();
cp.n_ctx     = 4096;   // hard cap; reserved up front, not grown on demand
cp.n_batch   = 512;    // logical batch submitted to llama_decode
cp.n_ubatch  = 128;    // physical batch: smaller keeps the prefill scratch buffer down
cp.n_threads = 4;
cp.n_threads_batch = 4;

cp.type_k = GGML_TYPE_Q8_0;   // 8.5 bits per element, not 8
cp.type_v = GGML_TYPE_Q8_0;

// A quantized V cache is only implemented on the flash-attention path. Leave this
// on AUTO and the backend probe decides for you; if it resolves to off, context
// construction throws "quantized V cache was requested, but this requires Flash
// Attention". Ask for it and find out at startup.
cp.flash_attn_type = LLAMA_FLASH_ATTN_TYPE_ENABLED;

llama_context * ctx = llama_init_from_model(model, cp);
if (!ctx) { /* fail here, where a user can be told something true */ }

// The header is explicit that the context may not have honoured what you asked
// for. Read back what you got before you size anything against it.
const uint32_t n_ctx_real = llama_n_ctx(ctx);
A memory knob constrains a compute knob here, in a direction nobody would guess. The only V-cache dequantization path that exists lives inside the fused attention kernel, so asking for the footprint saving forces the kernel choice. On this SoC that is free, since the CPU flash-attention path is there and slightly faster anyway. On a build where flash attention resolves off, however, your memory optimisation returns a null context.
Reserving 4k with q8_0 keys and values turns the 0.52 GB KV line into 0.27 GB
and makes it a fixed cost. It doesn’t make an 8B fit an 8 GB phone, because
nothing does. It buys a 3B or 4B enough room to hold a long conversation without
the kill.
The formats do not rank by size
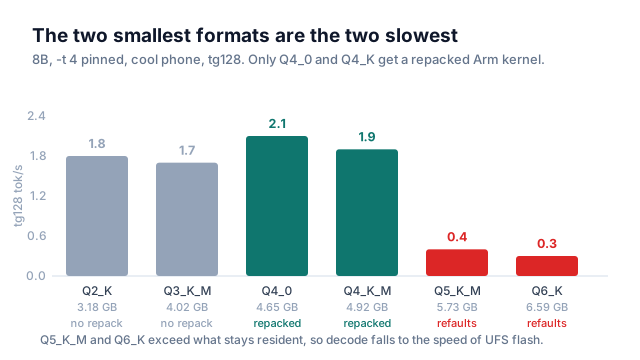
The received wisdom is that smaller quantization is faster, since decode is bandwidth-bound and a smaller file means fewer bytes per token. On this hardware that is wrong in both directions at once.
| Format | file size | real bpw | tg128 | what is limiting it |
|---|---|---|---|---|
| Q2_K | 3.18 GB | 3.17 | 1.8 | no repacked kernel |
| Q3_K_M | 4.02 GB | 4.00 | 1.7 | no repacked kernel |
| Q4_0 | 4.65 GB | 4.64 | 2.1 | bandwidth |
| Q4_K_M | 4.92 GB | 4.90 | 1.9 | bandwidth |
| Q5_K_M | 5.73 GB | 5.71 | 0.4 | residency (see note) |
| Q6_K | 6.59 GB | 6.57 | 0.3 | residency (see note) |
Q3_K_M is 0.9 GB smaller than Q4_K_M and 10% slower. The repack table selects the
4x8 and 8x8 variants when matmul_int8 is present and the 4x4 and 8x4 dotprod
variants otherwise. Q3_K has no entry at all and Q2_K’s is gated on AVX-512,
so on this chip neither has one and both fall through to the generic per-block
path. The extra unpacking work costs more than the 20% of bytes they save. That
generic path is also what --no-repack drops the whole model onto, which is why
the flag from the previous section has a price you can read off this table instead
of guessing at it.
The bottom two rows are a different failure in the same units, and they need a
caveat about when they were measured. On the build I benched, Q5_K and Q6_K
had no repack kernel, so their tensors stayed in the file mapping and thrashed:
5.73 GB exceeds what stays resident, about a third of the file was re-read off
flash on every decode step, and Q5_K_M came out five times slower than Q4_K_M
rather than 30% slower. Both have since gained dotprod repack kernels, which
moves their weights into anonymous memory and changes the failure instead of
fixing it. 5.73 GB of unevictable weights on top of the 4.50 GB floor is 10.23 GB
against 8 GB of physical RAM, so on a current build these two are killed during
load. I am leaving the rows in because the mechanism still applies to Q3_K, but
read them as history and pin your commit before quoting either number.
The real bits-per-weight column is worth a paragraph, because the nominal numbers
everyone quotes are wrong by a lot at the low end. Q2_K is nominally 2.6 bits and
comes out at 3.17. The reason is that Llama-3.1-8B has a 128,256-token vocabulary
with untied input and output embeddings, so the two embedding tensors are 1.05B
parameters, 13.1% of the model, and llama.cpp’s recipe keeps output.weight at
Q6_K for every K-quant. In a Q2_K file that single tensor is 431 MB of 3.18 GB,
which is 13.5% of the file for 6.5% of the weights. Aggressive quantization
doesn’t touch the part of the model that is already the largest single thing in
it.
Q4_K_M is where I keep landing. A Q4_K super-block is 256 weights split into
eight sub-blocks of 32, with 6-bit scales and 6-bit minimums per sub-block and
two fp16 values scaling those, which is what buys it accuracy over a flat
per-block scale. The _M is a mixed recipe on top: attn_v and ffn_down get
bumped to Q6_K on 16 of the 32 layers, and output.weight goes to Q6_K
everywhere. Attention output stays at Q4_K. That mix is why the file lands at
4.90 real bits per weight against a nominal 4.5.
Whichever format you pick, measure it on the task. Perplexity averages away the damage you care about. Q3 and below started dropping fields out of structured output and mangling numbers here, and the perplexity delta that came with that was 0.3.
Building for a chip that does not have the instruction
The build flag that shows up in every on-device llama.cpp writeup is this one:
# Do not ship this.
-DGGML_CPU_ARM_ARCH="armv8.2-a+dotprod+i8mm"
It will SIGILL here. i8mm names FEAT_I8MM, mandatory from Armv8.6-A and
optional before it, and neither the A78 nor the A55 implements it. So SMMLA is
undefined on both clusters and the process dies the first time a repacked kernel
runs. Dropping the baseline instead gives up i8mm on the phones that do have it,
which is every Cortex-A710-class core and newer. The answer is one shared object
per ISA level, chosen at runtime, and ggml builds them for you:
cmake -B build-android \
  -DCMAKE_TOOLCHAIN_FILE=$NDK/build/cmake/android.toolchain.cmake \
  -DANDROID_ABI=arm64-v8a -DANDROID_PLATFORM=android-28 \
  -DGGML_NATIVE=OFF \
  -DGGML_BACKEND_DL=ON \
  -DGGML_CPU_ALL_VARIANTS=ON \
  -DGGML_CPU_KLEIDIAI=ON \
  -DLLAMA_CURL=OFF
cmake --build build-android --config Release -j
GGML_CPU_ALL_VARIANTS requires GGML_BACKEND_DL and refuses to coexist with
GGML_CPU_ARM_ARCH, which is a helpful way of being told you have to pick one
strategy. On Android it emits a set of libggml-cpu-android_armv8.*.so files
covering baseline, dotprod, dotprod plus fp16, dotprod plus i8mm, and the
Armv9 tiers. Each carries a scoring function that reads
getauxval(AT_HWCAP2) & HWCAP2_I8MM and returns zero if the feature it was
compiled for is missing, so the loader picks the highest-scoring variant the
silicon can execute. On the 695 that resolves to the dotprod build and
the q4_K_8x4 kernel.
The packaging consequence is the part that is easy to miss. Those are separate shared objects, they have to end up in the APK’s native library directory, and something has to point the loader at them:
class LlamaBridge(context: Context) {
    init {
        System.loadLibrary("llama-android")   // the JNI wrapper
        // The CPU backends are dlopen'd, not linked. Hand ggml the directory the
        // installer unpacked them into; it scores each variant against HWCAP and
        // keeps the best one the device can run.
        nativeLoadBackends(context.applicationInfo.nativeLibraryDir)
    }
    private external fun nativeLoadBackends(dir: String)
}
with the native side calling ggml_backend_load_all_from_path(dir). Skip that
and the app runs on the scalar fallback, which is roughly half speed, with no
error anywhere.
GGML_CPU_KLEIDIAI is in that cmake line and it’s the flag I would now argue
about. Arm’s micro-kernels are selected at runtime from a table where each entry
declares the feature it needs, which is the right design and is why everyone
recommends the flag. The catch is coverage. KleidiAI’s buffer type accepts a
weight tensor only if it is Q4_0, Q8_0 or F32. Every K-quant and every IQ
type is declined, with one log line naming the type it couldn’t take. On a Q4_K_M
build that is every matmul in the model, so the flag buys nothing and the repacked
dotprod kernels do all the work regardless.
Where it does apply it doesn’t do what the recommendation implies either. KleidiAI
and repack are two entries in the same extra-buffer-type list, KleidiAI first, and
the loader walks that list in order. On a Q4_0 build KleidiAI wins the race to
cause the mmap problem from the memory section rather than sidestepping it. The
tensors leave the file mapping into a KleidiAI-owned allocation instead of a
repack-owned one, and the resident set is identical. That is also why
--no-repack switches KleidiAI off along with the repack kernels: one bool gates
the whole list, whatever the flag is named after. I left it in the cmake line
above because it is what you want if you ever ship Q4_0. On a Q4_K_M build, treat
it as inert.
Heat is a control loop you do not own
A phone has no fan and a battery it is trying not to cook. The thermal governor watches skin temperature and, as it climbs, drops clocks and parks cores. For bursty work this never appears. For sustained token generation, which is a dense steady load on exactly the units that produce heat, it appears in about twenty-five seconds and doesn’t lift while you keep generating.
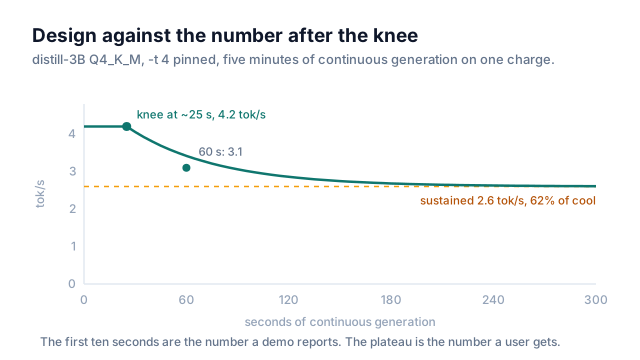
The shape is always the same: a plateau, a knee, a decay with a time constant around a minute, and a new steady state at roughly 60% of the cool rate. Report the plateau and you are reporting a number no user will see after their second question.
It is worth naming which knob the governor is turning, because by this article’s
own model only one of them matters. Mitigation is applied through cooling devices,
and the platform’s HAL has a type for each kind: CPU, GPU, modem, NPU, display,
camera, flashlight, speaker, battery, fan. Capping the big cluster and parking
cores slow the compute side, which decode has to spare. The mitigation that moves
the numerator of the bandwidth formula is a cap on the DDR and interconnect
frequency pair, and that is the one the taxonomy has no name for. It arrives, if
it is enumerated at all, as the catch-all COMPONENT type.
None of which reaches you anyway. The cooling-device list is a HAL interface and an app gets one headroom float covering everything at once. A decode loop watching a phone warm up sees a single number falling and can’t tell whether its compute got slower or its ceiling came down, and those have different fixes.
Android exposes the governor’s own view through
PowerManager,
and the useful call is not the status callback. It is getThermalHeadroom, which
returns a forecast: a float where 1.0 means the device is at the SEVERE
throttling threshold, with a forecastSeconds argument bounded to 60. It tracks
slow-moving sensors, so there is no benefit to polling faster than about once a
second, and polling significantly faster than that returns NaN. It also needs
several samples before it can extrapolate, so the first few calls after a cold
start return the current headroom whatever you asked for.
Then there is the case that matters most for the phones this post is about. The
documented return says NaN covers two conditions: you called significantly
faster than once per second, and the device doesn’t support the functionality.
They come from opposite ends of the stack. The rate limit is enforced inside
PowerManager in your own process, so that NaN never reaches the thermal
service. The other one means there is no skin-temperature sensor wired through a
thermal HAL to ask, which is a vendor decision a budget OEM is under no obligation
to make, and it describes a real share of the handsets in the 250 dollar bracket.
Yet at the call site the two are the same float. So a guard clause that returns on
NaN means either skip this tick or disable the whole adaptive scheme permanently
and silently, and which one it means depends on whose phone it is running on.
Paced at one call a second, the only way to tell them apart is that the permanent
one never clears.
// getThermalHeadroom is API 30. Gate the call site, and keep minSdk honest.
@RequiresApi(Build.VERSION_CODES.R)
class ThermalKnobs(private val pm: PowerManager) {
    private val BIG_ONLY     = intArrayOf(6, 7)          // the two A78s
    private val BIG_PLUS_TWO = intArrayOf(6, 7, 4, 5)    // plus two A55s
    private var lastKnobs: Knobs? = null
    private var nanRun = 0

    // Called once per second. Any faster and the framework hands back NaN by design.
    fun sampleAndAdjust() {
        val headroom = pm.getThermalHeadroom(30)         // forecast 30 s ahead
        if (headroom.isNaN()) {
            // Either the rate limit PowerManager enforces in this process, or no
            // thermal-headroom support on this device at all. Only the second is
            // permanent, and the only signal is that it never clears. Paced at
            // 1 Hz, a dozen in a row is that signal.
            if (++nanRun >= 12) useStatusListenerInstead()
            return
        }
        nanRun = 0

        val knobs = when {
            headroom < 0.75f -> Knobs(threads = 4, cpus = BIG_PLUS_TWO, maxNewTokens = 512)
            headroom < 0.95f -> Knobs(threads = 2, cpus = BIG_ONLY,     maxNewTokens = 512)
            else             -> Knobs(threads = 2, cpus = BIG_ONLY,     maxNewTokens = 128)
        }
        if (knobs != lastKnobs) {                        // rebinding a thread pool is not free
            lastKnobs = knobs
            InferenceBridge.applyKnobs(knobs)            // JNI into the runtime
        }
    }

    // Coarser, and reactive instead of a forecast, so the hysteresis is gone.
    // Not guaranteed on every handset either, but taking this branch is a fact
    // worth logging: it says the adaptive loop is off on this device.
    private fun useStatusListenerInstead() {
        pm.addThermalStatusListener { status ->
            val knobs = if (status >= PowerManager.THERMAL_STATUS_MODERATE) {
                Knobs(threads = 2, cpus = BIG_ONLY,     maxNewTokens = 256)
            } else {
                Knobs(threads = 4, cpus = BIG_PLUS_TWO, maxNewTokens = 512)
            }
            if (knobs != lastKnobs) {
                lastKnobs = knobs
                InferenceBridge.applyKnobs(knobs)
            }
        }
    }
}
Applying the knobs must not tear down the context, because rebuilding it throws away a KV cache you paid seconds of prefill for:
static ggml_threadpool * g_pool = nullptr;   // owned here, outlives each swap

// Called from the JNI bridge. The context and its KV cache are left alone.
void apply_knobs(llama_context * ctx, int n_threads, const int * cpus) {
    ggml_threadpool * next = make_pinned_pool(n_threads, cpus);
    llama_detach_threadpool(ctx);                     // must precede the free
    if (g_pool) { ggml_threadpool_free(g_pool); }
    llama_attach_threadpool(ctx, next, next);
    llama_set_n_threads(ctx, n_threads, n_threads);   // decode, then batch
    g_pool = next;
}
The thing it doesn’t buy is what I tried first. I inserted a deliberate idle gap between tokens on the theory that a lower duty cycle keeps the SoC under the trip point. Fifteen milliseconds on a 380 ms token is a 4% duty reduction against a skin-temperature time constant of a minute or more, and it did nothing I could distinguish from run-to-run noise. To move a thermal trip point by duty-cycling you need to give up something like a third of your throughput, which isn’t a trade worth making.
What the headroom forecast buys is hysteresis. The governor’s cut is deeper than the one you would make and it does not restore promptly, so dropping from four threads to two before the trip is reached holds a steady 2.9 tok/s where letting the governor decide oscillates between 4.2 and 2.6 and averages below it. That is roughly a 10% improvement on the sustained number, which is the honest size of the effect.
The accelerator you do not control
A Vulkan or OpenCL backend speeds up prefill, which is compute-bound and batched, but it does close to nothing for decode, because the Adreno pulls from the same LPDDR4X controller as the CPU. Offloading a bandwidth-bound kernel on a unified-memory SoC moves where the loads are issued and leaves the ceiling where it was. It also makes the previous section worse. The GPU is its own cooling device on the mitigation map, and heating it pulls the same skin budget the CPU cluster is drawing from.
The vendor NPU is a different kind of problem. NNAPI was the portable route to it and Google deprecated it in Android 15, telling NDK readers to expect most devices to use the CPU backend in future. Vendor delegates remain, but each supports the operations its driver author chose to support this quarter. A driver update that drops one operation out of the set sends that subgraph back to the CPU with a throughput drop and no error.
Distill first, then quantize
Read back up the format table and the problem is plain. The formats that preserve quality don’t stay resident. The largest one that does is 4.92 GB, and it still only manages 1.9 tok/s on a cool phone and 1.1 once the phone is warm. Quantization doesn’t clear this wall for an 8B on this hardware.
So the compression decision is not which quant. Write out what each knob touches
in the two formulas this post has already used and the asymmetry is the whole
argument. Bits per weight appears in exactly one place, the P · b_w that is both
the weights term of the footprint and the denominator of the roofline. It isn’t in
the KV expression, which is assembled out of layer count, key/value head count and
head dimension and never mentions the weight format. It isn’t in prefill, which
costs FLOPs, and FLOPs go with P. Parameter count is in all three.
Quantization therefore moves one of the three things that decide whether this ships, and the format table says it stops moving that one somewhere around Q4. Distillation moves all three, at correspondingly more cost: the teacher, a corpus of task-relevant prompts, and a training run using sequence-level knowledge distillation, where the student trains on sequences the teacher generated. The KV term is the one people forget when they compare the two. A 4k context reserved at context creation is a fixed tax paid in full before the first token, identical at every quantization level, and the only thing that reduces it is having fewer layers to cache.
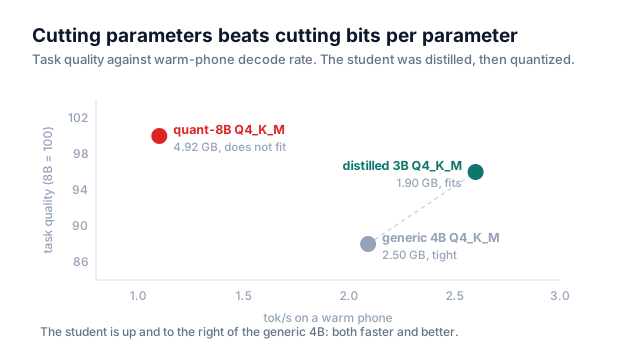
| Candidate | weights | tok/s cool | tok/s warm | task quality | fits 8 GB |
|---|---|---|---|---|---|
| Quant-8B (Q4_K_M) | 4.92 GB | 1.9 | 1.0 | 100 (ref) | no |
| Generic 4B (Q4_K_M) | 2.50 GB | 3.2 | 2.1 | 88 | tight |
| Distilled 3B (Q4_K_M) | 1.90 GB | 4.2 | 2.6 | 96 | yes |
Five runs per cell, llama-bench -n 128, medians. Cool is a phone idle for ten
minutes; warm is five minutes into continuous generation. The three do not decay
by a common factor, and should not: the 8B loses 47% because its decode is
bandwidth-bound and the memory controller clocks down under sustained load,
whereas the 3B loses 38% and is limited more by core frequency than by DRAM. The
larger the model, the more of the throttle it eats.
The student sits up and to the right of the generic 4B, which is the only comparison that matters: both faster and better, on a device where the 8B does not run.
The ordering question that actually bites is not distill-then-quantize, which is
the only order anyone runs. It is that the student’s format has to be picked
against the target chip’s kernel table rather than against a perplexity curve. A
3B at Q5_K_M is a smaller file than an 8B at Q4_K_M and looks like the safer trade
on quality. It is also the row this post has had to caveat twice, because whether
Q5_K has a repacked kernel decides whether those weights are evictable or
unevictable, and that is a property of your build rather than of the format. Pick
the format your chip has a kernel for, and check it is still true at the commit
you ship.
One number from the deployed 3B is worth stating because it reorders the optimisation list. Cold start to first token is about 10.0 seconds: 0.3 for process and backend init, 0.7 for the mmap and metadata parse, 2.4 faulting 1.9 GB off UFS at roughly 800 MB/s, and 6.6 prefilling a 200-token system prompt at 30 tok/s. The prefill dominates by a factor of three over the flash read.
Every piece of advice about madvise and prefetch is aimed at the 2.4, but the
fix worth building is caching the system prompt’s KV so that 6.6 becomes zero on
every run after the first, which leaves a warm start at the 1.0 second of init and
mmap.
On the madvise advice itself: llama.cpp already issues
posix_fadvise(POSIX_FADV_SEQUENTIAL) on the file descriptor, sets
MAP_POPULATE when prefetching, and calls posix_madvise(POSIX_MADV_WILLNEED)
over the prefetch region. Layering your own hint on top of that is at best
redundant. And if you do write one, MADV_SEQUENTIAL | MADV_WILLNEED isn’t two
hints. The constants are 2 and 3, the bitwise or is 3, and you have written
MADV_WILLNEED with extra steps. madvise takes one advice value per call.
What happens when the user leaves
The rest shows up once the app is on a real phone and the user does something other than watch it generate. Backgrounding is the case to design for, because two mechanisms fire and they point in opposite directions.
The first is the kill list. A visible app sits at oom_score_adj 0. A cached one
sits far above that, and lmkd works down from the highest adjustment it can find
before size enters the decision at all. So the instant the user switches away,
your process goes from the last thing lmkd would take to among the first, still
carrying the largest anonymous resident set on the device.
The second is the freezer. From Android 14 a cached process is frozen through the
kernel’s cgroup v2 freezer about ten seconds after entering that state, and frozen
means every thread stops. A generation in flight doesn’t fail. It pauses, with no
exception, no callback and nothing in logcat. The token stream goes quiet and
the wall clock keeps running, so tokens per second computed across that window
measures the user’s attention rather than the phone.
The remedy for both is a foreground service, and the remedy restates the problem. It keeps you off the cached list and out of the freezer, which is to say it keeps 4.62 GB of unevictable weights resident while the user is somewhere else. You are asking the system to hold the largest allocation on the device through the window in which it has the best reason to reclaim it, and on a phone this size that request is granted at someone else’s expense.
The honest design goes the other way. Let the generation stop, keep the prompt replayable, and treat losing the model to a background transition as a state with a code path rather than a crash.
When not to put it on the phone
Often the honest answer is not to. If the phone has a network most of the time and the task tolerates a round trip, a server holds a better model with none of this. On-device earns its cost when the requirement is hard: data that can’t leave the device, an app that must work with no connection, or per-request economics that don’t close at your scale.
If it does earn it, a 6 GB phone and an 8 GB phone are different products from the model’s point of view, so gate the variant on device tier at runtime. Two gigabytes in app storage is the first thing a cleanup screen offers to delete, so treat a missing model as a normal state to recover from.
The demos that skip all this are not wrong about what a phone can do for ten seconds. They are silent about the second minute, on the cheaper handset, which is the phone most of your users are holding.