Head-based sampling decides whether to keep a trace at the very start, before anything has happened. When the interesting events are 1% of traffic and you keep a flat 10% at the head, you retain about one in ten failures, chosen by a coin the failure never touched. Agent systems make that trade worse than usual, because a failure is often not an error. A planner dispatches to three tool-agents and returns a confident answer with nothing behind it. Error rate flat, latency normal, no exception anywhere, and the trace you would want to open does not exist.
Tail sampling is the fix, and it works. But it also has three failure modes that lose exactly the traces it was adopted to protect, none of them visible in the configuration and none of them logged as an error. This post covers the span schema, the drop that happens in your own process before any of this starts, those three failure modes and how to size and operate around them, content and cardinality limits, and the statistics that keep dashboards honest once you are deliberately discarding most of your data. Configs and metric names are checked against the current Collector source. The details are where this goes wrong.
The attribute schema
An agent run is a tree of spans. The root is the invocation; its children are model calls, tool calls, and sub-agents, each with children of their own. The judge sits outside that tree, in a trace of its own, reaching back in by span link rather than by parentage, for reasons the section on linking a score to its trace works through at the end.
flowchart TD
  R["invoke_agent planner"] --> P["chat gpt-4o-2024-11-20"]
  P --> T1["execute_tool retrieve"]
  P --> T2["execute_tool sql_query"]
  T1 --> E["embeddings text-embedding-3"]
  P --> S["invoke_agent summarize"]
  S --> G2["chat gpt-4o-2024-11-20"]
  J["eval.judge<br/>separate trace, minutes later"] -. span link .-> R
  style R fill:#0f766e22,stroke:#0f766e,stroke-width:2px
  style J fill:#0f766e22,stroke:#0f766e,stroke-width:2px
Most keys come from the OpenTelemetry
GenAI semantic conventions,
so a backend written by someone else knows what gen_ai.usage.input_tokens means,
which is the whole reason to use them rather than a house schema, and they are
still experimental and have already moved once.
# one agent-step span, attributes per the OTel GenAI semantic conventions.
# opt in to the current key set with:
#   OTEL_SEMCONV_STABILITY_OPT_IN=gen_ai_latest_experimental
span_attributes = {
    "gen_ai.provider.name": "openai",       # replaces the deprecated gen_ai.system
    "gen_ai.operation.name": "chat",        # chat | embeddings | execute_tool | invoke_agent
    "gen_ai.request.model": "gpt-4o-2024-11-20",
    "gen_ai.response.model": "gpt-4o-2024-11-20",
    "gen_ai.usage.input_tokens": 3480,
    "gen_ai.usage.output_tokens": 412,
    "gen_ai.request.temperature": 0,
    "gen_ai.response.finish_reasons": ["stop"],
    "gen_ai.agent.name": "planner",
    "gen_ai.tool.name": "sql_query",        # set on tool spans, unset on model spans
    "app.agent.step": 3,
    # your own operational keys: keep these bounded
    "app.tenant_tier": "enterprise",        # a small enum, safe as an attribute
    "app.eval.score_pct": 42,               # int 0-100, never a float; the sampler section explains why
}
The rename in that first line is the one to internalise. gen_ai.system became
gen_ai.provider.name, and the failure isn’t an error. Instrument to the old key
and your provider breakdowns split silently across two names, each looking like a
smaller version of the truth.
Instrumenting a tool call has a detail the API only teaches by punishing you. When
a tool throws, you want to record the exception once and set span status to
ERROR. The obvious code records it twice.
from opentelemetry import trace
from opentelemetry.trace import SpanKind, Status, StatusCode

tracer = trace.get_tracer("agents.runtime")

def run_tool(name, args, fn):
    # start_as_current_span defaults record_exception=True and
    # set_status_on_exception=True. Leave them on and the context manager
    # re-records the exception on exit: two full stacktraces per failure, and
    # the str[:200] truncation below is thrown away. So we own the recording.
    with tracer.start_as_current_span(
        f"execute_tool {name}",
        kind=SpanKind.INTERNAL,
        record_exception=False,
        set_status_on_exception=False,
    ) as span:
        span.set_attribute("gen_ai.operation.name", "execute_tool")
        span.set_attribute("gen_ai.tool.name", name)              # bounded, safe as an attr
        try:
            out = fn(**args)
            span.set_attribute("app.tool.result_rows", getattr(out, "row_count", 0))
            return out
        except Exception as e:
            span.record_exception(e)                              # once, with our message
            span.set_status(Status(StatusCode.ERROR, str(e)[:200]))
            raise
That status is the flag the sampler keys on. A tool that catches its own exception and returns a sentinel value never sets it, so the trace never looks like a failure, so the keep-errors policy below can’t see it. This is the first place the two halves of the system couple: an instrumentation choice made by whoever wrote the tool decides whether a retention policy owned by whoever runs the collector can fire at all. To the sampler, a swallowed exception isn’t a failure at all.
The span that never left the process
Everything after this section assumes a collector received the span. The SDK does
not promise that. The batch span processor holds finished spans in a fixed-size
queue,
OTEL_BSP_MAX_QUEUE_SIZE,
default 2048, drained by a background thread on a schedule delay. When a span
arrives at a full queue the SDK logs a warning, counts a drop, and appends the
span anyway.
The queue is a bounded deque. New spans go on the front and the exporter pops from the back, so the append pushes something off the far end, and what gets discarded is the oldest span still waiting, the one that was next to be exported. Follow that in the direction it runs. A burst does not lose its own spans; it evicts the ones queued behind it, which belong to whatever was running immediately before, so the trace that ends up with holes is the neighbour of the incident.
The queue is also denominated in spans while everything downstream of it is denominated in traces. 2048 is a reasonable default for a service where a request is two or three spans. An agent run is a whole tree of them. The drop is counted, but in the SDK’s own telemetry, inside your application process, on a meter most people never wire up. No collector metric will show it. The span never reached a collector.
Three ways tail sampling loses the trace anyway
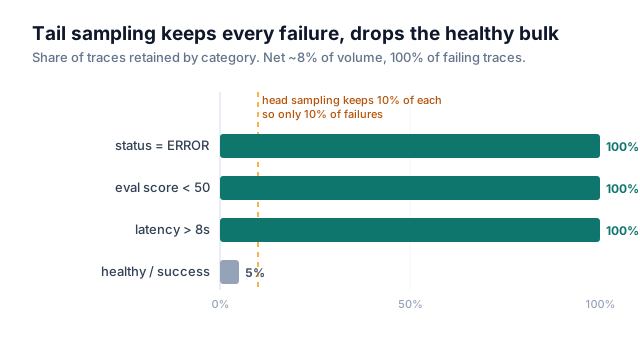
Tail sampling buffers a trace and decides after it can see how the trace ended. The policy set is a composite where any policy voting to keep wins, expressing “keep anything that failed, anything scored low, anything slow, and a slice of the rest”.
processors:
  tail_sampling:
    decision_wait: 30s          # buffer a trace this long before deciding
    num_traces: 200000          # buffered-trace ceiling (the default is 50000)
    block_on_overflow: true     # backpressure at the ceiling instead of evicting oldest
    decision_cache:
      sampled_cache_size: 2000000        # remember decisions so a late span can't re-open a trace
      non_sampled_cache_size: 2000000
    policies:
      - name: keep-errors
        type: status_code
        status_code: { status_codes: [ERROR] }
      - name: keep-low-eval-score
        type: numeric_attribute
        # app.eval.score_pct has to be an int; a float here is read as 0 (see below)
        numeric_attribute: { key: app.eval.score_pct, min_value: 0, max_value: 49 }
      - name: keep-slow
        type: latency
        latency: { threshold_ms: 8000 }
      - name: sample-the-rest
        type: probabilistic
        probabilistic: { sampling_percentage: 5 }
That configuration looks complete. Three things can throw away a trace it would have kept, and none of them logs an error.
The first is that the buffer can evict before it decides. num_traces is the
ceiling on traces held in memory, and by default when it is full and a new trace
arrives, the oldest is dropped. If that trace’s decision window hadn’t elapsed, it
leaves without any policy evaluating it. block_on_overflow: true is the
current-source escape hatch. It applies backpressure at the ceiling rather than
evicting, converting a lost trace into a slow one. Whether eviction is a live risk
at your volume is a sizing question that the next section works out. The short
version: it is a burst phenomenon, and bursts are when failures arrive.
The second is that late spans miss the vote. The decision fires when
decision_wait elapses, timed from when the processor first saw the trace, not
from when the trace completed. A tool that times out at 45 seconds against a
30-second window produces an ERROR span that lands after its own trace was
judged healthy and released. That is the wrong end to lose, since the failures
with the longest tails are the ones it drops. Some relief is available:
decision_wait_after_root_received lets the timer key off the root span instead
of first arrival, and the decision_cache above remembers the verdict so a
straggler inherits it instead of starting a second, half-empty trace.
The third invalidates the mechanism outright, and it is the easiest to miss because it only appears once you scale out. Every span of a trace must reach the same collector instance, since a decision needs the whole trace, which presumes the trace id survived every hop between your agents in the first place. Put two sampler replicas behind an ordinary Kubernetes service and the spans spread across both. Each replica sees a fragment. Each makes a confident decision on partial evidence.
The fix is a two-tier pipeline: a first layer whose only job is to hash
spans to a backend by trace id using the loadbalancing exporter, and a second
layer that actually samples.
# tier 1: hash by trace ID so every span of a trace lands on a single sampler instance
exporters:
  loadbalancing:
    routing_key: traceID        # already the default for traces; stated to be explicit
    protocol:
      otlp:
        tls: { insecure: true }
    resolver:
      # This has to resolve to per-pod IPs. A normal ClusterIP service returns one
      # virtual IP, so every trace pins to a single backend and kube-proxy
      # round-robins behind it, which breaks trace-id affinity. Use a headless
      # service (clusterIP: None), or switch to the k8s resolver.
      dns:
        hostname: otel-sampler.observability.svc.cluster.local
        port: 4317
The trap isn’t the routing key. traceID is already the default for traces, so
the config that looks wrong is fine. The trap is the resolver. Point the DNS
resolver at a normal ClusterIP service and it resolves to one stable virtual IP,
so every span goes to the same single entry in the ring and the affinity you
wanted never happens.
What you need is a hostname that resolves to every pod,
which is what a headless service gives you, or the k8s resolver, which watches
EndpointSlice objects directly and needs RBAC to get, list, and watch
them. A service-type decision, three lines away in a Helm chart owned by a
different team, silently determines whether your sampling is correct.
A smaller trap sits in that policy set, and it runs the opposite way to the one
people expect. The numeric_attribute policy reads its value through the integer
accessor, which returns 0 for any non-integer type. Store the judge score as a
float 0.42 and the policy reads 0, and since the range starts at min_value: 0,
every float score falls in [0, 49] and matches. The policy does not keep
nothing, but keeps everything at full rate, and the first sign is the bill.
That is why the schema stores app.eval.score_pct as an int 0 to 100. The failure inverts on the boundary you
chose: had you written min_value: 1, the same floats would read as 0 and match
never.
The loop that runs those policies has a quieter version of the same problem. When
an evaluator returns an error, the processor increments a counter, logs at debug
level, and continues to the next policy. It doesn’t vote. In a composite where any
keep wins, a policy that failed to evaluate and a policy that declined to keep
produce the same output, so a broken policy is invisible in the decision and
appears only in sampling_policy_evaluation_error. Your keep-errors guarantee can
be void because a different entry in the list has a typo in it.
How big the buffer actually has to be
Memory is roughly the mean trace size times how many traces are in the buffer, and the buffer holds the smaller of what has arrived and the ceiling you set:
The min is the part the memory-exhaustion stories leave out. At a steady arrival
rate the buffer holds about traces regardless of
how high you set num_traces, so the ceiling costs nothing until traffic fills it.
Take this system: 1.5 million runs a month is 0.58 traces a second, so with a
30-second window the buffer holds about 17 traces against a ceiling of 200,000, and
is 0.01% full. Eviction would not begin until sustained arrivals crossed
num_traces / decision_wait, about 6,700 traces a second, four orders of magnitude
away.
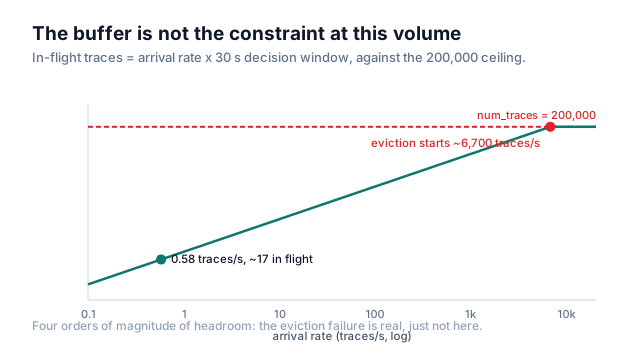
So eviction is not your problem at this volume. It is still worth knowing when it
becomes one, and it takes two things lining up. First you shrink num_traces to
cap collector memory on a workload with fat spans, because the heap ceiling is
num_traces times mean trace size and that product gets real: 200,000 traces at
168 KiB each is about 33 GiB if the buffer ever fills. Then a burst multiplies
. Because failures cluster in bursts, eviction risk peaks under exactly
the traffic that produces the traces you want. Size the ceiling to your peak.
with a headroom factor of two or three. Do not trust that arithmetic on its own, because the sampler will tell you the truth if you ask it:
Metric (drop the otelcol_processor_tail_sampling_ prefix) | Reads on | Alert when |
|---|---|---|
sampling_trace_dropped_too_early | traces evicted before their decision | any sustained nonzero rate |
sampling_late_span_age | how late post-decision spans arrive | p95 approaches decision_wait |
sampling_trace_removal_age | how long a trace lived in memory | it drifts below decision_wait |
sampling_decision_timer_latency | time to run one decision pass | it climbs toward the one-second tick |
sampling_traces_on_memory | traces the buffer is holding | it pegs at the ceiling, see below |
The first is the one that matters, because it is the direct measurement of the
promise the config only implied. If sampling_trace_dropped_too_early is nonzero,
your keep-100%-of-errors policy is already false, by exactly that count, and no
other signal would have told you. The decision cache adds
early_releases_from_cache_decision so you can see the late-span path working too.
Alarm on these before you trust the policy set to describe reality.
A couple of things about the window are visible only in the source. decision_wait
becomes a pipeline of one-second batches, one closed per tick, so the window is
quantised to whole seconds. And expected_new_traces_per_sec, the setting that
reads like a capacity control, is the initial capacity hint for each of those
per-second batch maps. It doesn’t cap admission. It doesn’t enter the memory
bound. Setting it near your arrival rate buys a Go map that stops rehashing every
tick.
The decision cache has a second job nobody advertises. Both cache sizes default to zero, which installs a no-op, and the release path writes each decision into the cache and then reads it straight back to decide whether to evict the trace from the in-memory map. Against a no-op that read always misses, so a decided trace keeps its entry until the overflow queue reclaims it. Its spans are already gone, so this isn’t a leak worth alarming on.
But sampling_traces_on_memory counts map entries, so with no cache configured
the gauge you would size num_traces from climbs to the ceiling and stays there
whatever the load is doing. Configuring the cache for late-span protection is also
what makes your capacity gauge mean what its name says. Size it well above
num_traces, as the processor’s own documentation asks, and then budget for it: a
fixed-capacity LRU that fills once, never shrinks, and is in neither num_traces
nor the formula above.
maximum_trace_size_bytes is the knob people find after the first restart. It
drops a trace the moment its accumulated size crosses the limit, setting the
decision to not-sampled and pulling it out of its decision batch before any policy
has run.
It is a memory guard with no view of content, but in an agent system the
largest traces are the runaway ones: the retry storm, the loop that retrieved forty
chunks and then retrieved forty more. That is the population the pipeline exists to
capture. traces_dropped_too_large is its counter, and unlike the eviction counter
it will be nonzero from the day you set the knob.
The size it measures is the protobuf-marshalled size of the arriving batches, which is a wire number, and what you are protecting is Go heap.
The in-memory form is not the serialised one: every attribute is a struct around a tagged value, every string
its own allocation, held decoded for the whole window. Nobody publishes the ratio
and it moves with your attribute shape, so the only way to get it is to divide the
collector’s resident set by sampling_traces_on_memory on your own traffic. That
is the one number here you can’t read off an invoice.
Pairing the sampler with the memory_limiter processor is standard advice, and its
limits are worth being honest about. Over its soft limit it refuses new data, which
pushes backpressure upstream, and it forces garbage collection. Neither action,
however, can reclaim the memory the sampler is legitimately holding, because the
live idToTrace map of buffered traces is reachable and GC cannot touch it. Under
genuine sampler pressure the limiter sits at the ceiling refusing spans and
thrashing GC without relief. It bounds the blast radius, but it does not resize
the buffer for you.
GOMEMLIMIT is what people reach for next. It is the same controller again rather
than a second line of defence. The limiter polls runtime.MemStats on its
own interval and calls runtime.GC(); it never reads GOMEMLIMIT. The Go runtime,
given a memory limit, drives collection off the same live heap the limiter is
watching. So you have two controllers reading one input, and the only lever either
has is a collection that cannot free a reachable map.
Go’s own
GC guide is explicit that the limit is soft and that
the runtime caps GC at roughly half the process’s CPU time, so a limit set too low
degrades a program instead of stalling it. That cap is what you will observe: an
undersized num_traces does not present as an OOM kill, it presents as a collector
doing the same work at half speed, surfacing as sampling_decision_timer_latency
climbing toward the one-second tick that drives the decision loop.
Deploys are where all of this gets tested, and the default is not the one you would guess.
On shutdown the processor closes its work channel, stops the batcher, and
evaluates every trace still in the buffer against the full policy set, which means
a trace that arrived two seconds ago is judged as though its thirty-second window
had elapsed. The tool call that will fail has not returned, no span carries ERROR,
no score is on the root, so the composite falls through to the probabilistic
policy. The knob is drop_pending_traces_on_shutdown, and because it is off by
default the default is not “drop pending traces” but “decide them early”.
None of the drop metrics move for this. These are ordinary decisions, recorded next
to every honest one, and sampling_trace_dropped_too_early counts evictions rather
than premature verdicts. The signature of a rollout is a step in the keep rate with
every alarm silent, one window per replica, each a stretch where the sampler is
doing head sampling on whatever happened to be buffered. Drain slowly. Put deploy
markers on the dashboard where you read the keep rate. groupbytrace in front of
the sampler is still worth having for out-of-order arrival at one instance, though
it reassembles per instance only and holds its own copy of the trace before the
sampler’s window even starts.
Two ways instrumentation gets expensive
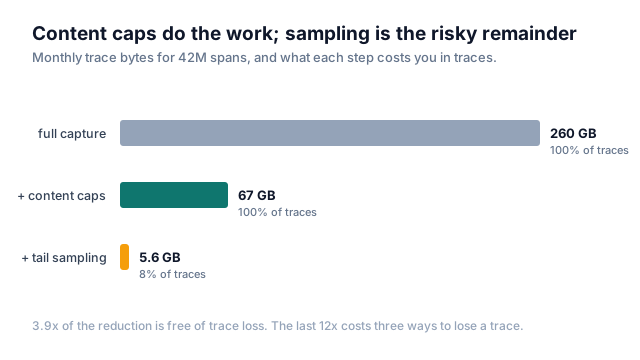
Turning on full content capture, prompt and retrieved context and output on every span, took the trace bill from 67 GB a month to 260, a factor of 3.9, inside a week. Agent spans have a fat-tailed size distribution. A tool span with metadata is under a kilobyte. An LLM span carrying a prompt with forty retrieved chunks is fifty times that.
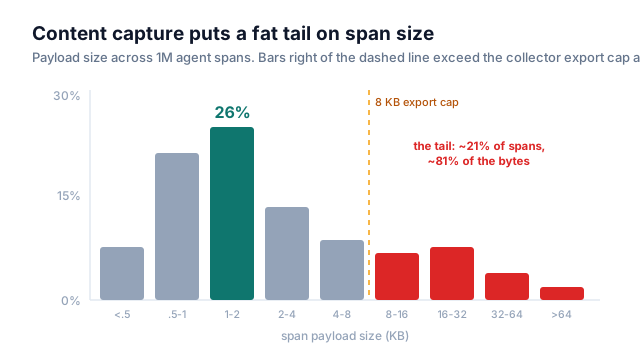
Capture is opt-in behind OTEL_INSTRUMENTATION_GENAI_CAPTURE_MESSAGE_CONTENT for
this reason, and where a language has moved to the newer enum the value decides
whether content lands on the span, on an event, or on both. Your redaction rules
and your reporting queries both have to agree with that choice, which is easier to
settle before either exists. Decide per field, and trim where the attribute is set:
| Content | Where it goes | Cap | Why |
|---|---|---|---|
| prompt / completion | span attribute (opt-in) | 2 KB | enough to debug, bounded size |
| retrieved RAG context | blob store, hash on the span | not inline | the 40 KB tail lives here |
| tool arguments | span attribute | 1 KB | usually small, occasionally not |
| PII fields | redacted or hashed | n/a | never leaves the process raw |
The second trap catches careful people, because it looks like good
instrumentation. Adding user_id as a metric label to break success rate down by
user is fine on a span but ruinous on a metric. Four bounded labels at 6 by 8 by 3
by 8 are about 1,150 series; the same metric with 1.2 million distinct user ids is
over a billion.
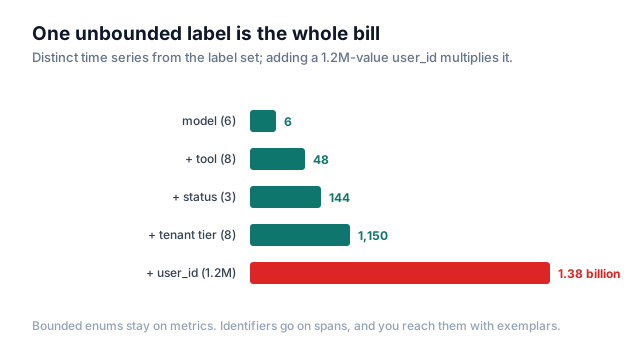
What makes this specific to the pipeline, rather than general Prometheus advice, is where the sampler is not. Identifiers cost bytes on a span and the sampler throws most of those bytes away, which is what makes spans the safe place to put them. The metric derived from the same instrumentation is aggregated at full rate in the SDK, before any collector, and its cost scales with distinct label values rather than with volume.
So the control you installed to make traces affordable has no effect at all on the axis the metrics bill runs along. Exemplars bridge the two by attaching a trace id to a metric bucket. They are only useful if the trace they point at survived the sampler.
Redaction and truncation belong in the pipeline ahead of the sampler, so raw content never reaches the backend even if instrumentation slips.
The detail that bites is that a context: span block does not touch span-event attributes, and
span events are where message content is migrating, so a scrubber that lists only
span misses the thing it was written to catch.
processors:
  transform/scrub:
    trace_statements:
      - context: span
        statements:
          - replace_all_patterns(attributes, "value", "[\\w.+-]+@[\\w-]+\\.[\\w.-]+", "<email>")
          - replace_all_patterns(attributes, "value", "\\b\\d{3}-\\d{2}-\\d{4}\\b", "<ssn>")
          - truncate_all(attributes, 4096)          # blanket backstop; per-field caps happen upstream
      - context: spanevent
        statements:
          # span-event attributes are a separate context; the span block never reaches them
          - replace_all_patterns(attributes, "value", "[\\w.+-]+@[\\w-]+\\.[\\w.-]+", "<email>")
          - truncate_all(attributes, 4096)
  memory_limiter:
    check_interval: 1s
    limit_percentage: 75          # cgroup quota if one is set, else total host memory
    spike_limit_percentage: 15
truncate_all shortens string values and skips arrays and other types, and its
limit is in bytes, so it is a backstop for stray long strings rather than the
per-field policy in the table above.
Un-biasing the dashboards afterward
Once you keep every failure and one in twenty healthy traces, stored traces are a biased sample by construction. Compute “what fraction of runs used the sql tool” off stored spans and you overcount whatever correlates with failing.
The correction is what survey statisticians use for stratified sampling: weight each retained trace by the inverse of the probability it was kept. A failing trace kept at probability 1 counts once; a healthy trace kept at 0.05 stands in for 20. That is the Horvitz-Thompson estimator.
def weighted_count(traces):
    total = 0.0
    for t in traces:
        kept_for_cause = t.had_error or t.eval_score_pct < 50 or t.latency_ms > 8000
        p = 1.0 if kept_for_cause else 0.05
        total += 1.0 / p                # Horvitz-Thompson estimate of the true count
    return total
The temptation is to say error counts need no correction, since they were kept at probability 1. That is true only to the extent the three failure modes are closed. A failing trace is kept with probability 1 only if it survived eviction, arrived inside the window, and reached the right collector; where any of those bit, a p=1 trace is simply gone, and its inverse-probability weight is missing from the sum. So the four drop metrics from the sizing section are not only capacity alarms. They are the audit on this estimator, the thing that tells you whether “kept at probability 1” is a fact or an aspiration.
The tidy alternative to hardcoding 0.05 is consistent probability sampling,
where the processor stamps the effective threshold into tracestate under ot=th:
and the backend reweights without anyone guessing. Check before you build on it.
In the tail sampler that behaviour sits behind an alpha feature gate that is off
by default, and with the gate off the probabilistic policy writes nothing at all.
The general point holds whichever way you record the rate: the moment you sample,
counts stop being counts.
Linking a score to its trace
A span link from the judge back to the graded run turns “this run scored 0.3” into a click that opens the trace.
from opentelemetry.trace import Link, SpanContext, TraceFlags

def link_eval_to_trace(trace_id: int, span_id: int, score: float):
    graded = SpanContext(trace_id=trace_id, span_id=span_id,
                         is_remote=True, trace_flags=TraceFlags(0x01))
    with tracer.start_as_current_span(
        "eval.judge",
        links=[Link(graded, attributes={"link.type": "evaluates"})],
    ) as span:
        span.set_attribute("app.eval.score_pct", round(score * 100))   # int, for the sampler
This runs straight into the ordering problem the sampling section set up. The judge
usually runs offline, minutes after the trace closed and the collector decided. If
the graded run looked healthy at runtime it was in the ~92% you dropped, so you get
a low score pointing at a trace that no longer exists. The keep-low-eval-score
policy only fires if the score is on the span before the decision does.
Splitting the judge in two resolves it. A fast guardrail judge runs inline,
writing app.eval.score_pct on the root span before the trace closes so the
sampler can see it. A slower judge runs offline for depth, over the traces already
kept plus a small high-risk cohort retained at 100% so it always has real traces
to land on. It isn’t elegant, but it is the only arrangement I have found that keeps
“a low score opens its trace” true when the score and the decision happen minutes
apart.
What a span costs you
Wrapping each iteration of a retry loop in its own span costs three times over, and
only one of the three is storage. It inflates the mean trace size in that memory
formula, it spends the client-side queue in span units, and it walks the trace
toward whatever maximum_trace_size_bytes you set, the one limit that drops a
trace with no policy consulted. Span the model call, the tool call, and the agent
step, and put the retry count on the span as an attribute.
The cost math is smaller than the ceremony around it suggests. On consumption-priced tracing, roughly $0.50 per GB ingested with a couple of weeks of retention, this traffic is about 260 GB a month at full capture, near $130. What matters is what each control buys. Content caps alone, keeping 100% of every trace, take 260 GB to about 67 GB, because the fat tail was almost all captured content, and they lose not one trace. Tail sampling on top takes 67 GB to about 5.6 GB stored, a further 12x and a further $30 a month, while adding the three ways to lose a trace above and a collector tier sized to buffer everything so it can decide at the tail.
The ordering is the lesson, and the lesson isn’t that tail sampling fails to pay. It is the exchange rate. The first 3.9x costs a config change and loses no traces. The remaining 12x costs three failure modes, a buffered collector tier, and an estimator you have to reason about every time someone reads a dashboard. Do the free one first, then decide whether you want to buy the second.
Below a certain volume none of the machinery earns its seat. At a few thousand invocations a day, keep everything, skip tail sampling, and revisit the first time content capture or cardinality shows up on an invoice. All three failure modes follow from buffering and routing at scale, and none of them can happen to a pipeline that is not sampling. The client-side queue drop is the exception: that one is waiting for you at any volume, on the first burst.
The last bet is that the standard is unfinished. The GenAI conventions are experimental, the keys have moved more than once, and the rename that bit me is the one your sampler config depends on: a policy keyed to an attribute name is a string match, so a convention rename is a silent policy failure with the same signature as everything else here. Keep every convention key behind one mapping module, so a rename is a one-line change instead of a sweep, and so the sampler config and the instrumentation read the key from the same place.
The conventions give you a vocabulary. What they do not give you is the knowledge that your retention policy is a statement of intent, that it degrades under exactly the traffic that produces failures, and that it is void if you scaled your collectors the obvious way. That part is design work, and most of it is learned by going to open a trace and finding it was never kept.