A VPC Service Controls perimeter exists to stop data leaving, while a fleet of agent tools exists to reach data, some of it on-prem and some behind third-party APIs. Putting the second inside the first is most of the work in deploying agents at a regulated company, but almost none of it appears in the tutorials, which assume a project with open egress. The part that cost me the most time wasn’t the egress rules at all; it was that the two content screens I had put inline, Model Armor and Sensitive Data Protection, are themselves Google APIs, so they sit on the far side of the same wall as everything else. One of them cannot be reached through Private Google Access at all, both have per-project rate quotas low enough to shape the design, and one of them answers a screening request that never ran with a field that reads like a pass.
Where the perimeter’s authority stops
Everything the agent can touch lives in one project inside a service perimeter. A tool call crosses the boundary twice in different senses, and the two crossings are governed by different products.
flowchart LR
  subgraph P["VPC-SC perimeter (tools project)"]
    A[Agent runtime] --> W[Tool wrapper]
    W --> SM[Secret Manager]
    W --> MA[Model Armor screen]
    W --> DLP[Sensitive Data Protection]
    W --> HC[Pooled httpx client]
  end
  SM -.PSC, vpc-sc bundle.-> G[(Google APIs)]
  DLP -.PSC, vpc-sc bundle.-> G
  MA -.PSC regional endpoint.-> R[(modelarmor.REGION.rep)]
  HC --> SWP[Secure Web Proxy]
  SWP --> TP[Third-party API]
  style MA fill:#0f766e22,stroke:#0f766e,stroke-width:2px
  style SWP fill:#0f766e22,stroke:#0f766e,stroke-width:2px
VPC Service Controls governs the Google-API hops on the left, and its
egress rules
name project numbers, service names and methods. The one non-Google thing
egressTo accepts is externalResources, a field that exists for BigQuery Omni.
The overview page says the rest plainly: the perimeter does not block access to
third-party APIs or services on the internet, so a payments vendor is simply not
a resource VPC-SC has an opinion about. The vendor hop belongs to Secure Web
Proxy instead, and how much of it you can express was settled by a deployment
choice somebody made before you arrived. In next-hop mode a sessionMatcher can
hold host() == "api.payments-vendor.example.com" off the SNI with no
decryption, whereas in explicit-proxy mode, which is what a runtime with an
HTTPS_PROXY variable is doing, host matching is available at neither the
session nor the application level, because the request details are encrypted and
destination.ip is not an attribute on offer there. The same rule text is a
hostname allowlist in one mode and unwritable in the other.
TLS inspection
closes the gap, upgrading host matching to path matching in next-hop mode and
supplying host matching at all in explicit-proxy mode, and either way it wants a
Certificate Authority Service pool and a root your workloads already trust.
| Crossing | Enforced by | What it can express | Where it fails |
|---|---|---|---|
| Secret Manager, KMS, GCS, DLP | VPC Service Controls | project numbers, service names, methods | PERMISSION_DENIED, code 7 |
| Model Armor | VPC Service Controls | same, but only over a PSC endpoint | TLS or 404 before policy |
| api.payments-vendor.example.com | Secure Web Proxy | in explicit-proxy mode, nothing until TLS inspection is on | proxy refuses the CONNECT |
Getting that split wrong is how a tightening exercise breaks a tool. Scoping down
an egress rule with identityType: ANY_IDENTITY and no operations filter is
correct as far as it goes, but it cannot govern the vendor, and it very easily
loses a Google-API hop nobody remembered was in the path.
An egress rule has to name the whole dependency graph
A payment-submission tool started returning empty results, and the agent kept running, because an empty tool result isn’t an exception, only an unhelpful string, and the model narrated its way past it into a confident answer about a payment nobody had checked. The tool does not make one call: before it reaches the vendor it reads an API key from Secret Manager, decrypts a request template with a KMS key, and pulls the template itself from Cloud Storage, each of them a Google API subject to the perimeter. The tightened rule allowed the vendor hop that VPC-SC was never enforcing anyway, but dropped two of the three hops it does govern.
Perimeter denials do not appear in the data-access log. They land in the policy audit log, in the project the perimeter protects, which for an egress violation is the project the call left rather than the one it was aimed at:
gcloud logging read '
  log_id("cloudaudit.googleapis.com/policy")
  AND severity=ERROR
  AND protoPayload.metadata."@type"=
      "type.googleapis.com/google.cloud.audit.VpcServiceControlAuditMetadata"
  AND protoPayload.metadata.egressViolations:*
  AND NOT protoPayload.metadata.dryRun:*
' --project=tools-prod --freshness=6h --format=json
dryRun is the term worth pausing on, because it is a boolean that an enforced
violation does not carry at all, so the natural dryRun!="true" compares against
an absent field; test for presence and negate that. In what comes back,
vpcServiceControlsUniqueId is what goes into a support case, and each entry in
egressViolations carries source and targetResource as project numbers,
which is also the format the rule itself demands, so writing
projects/secrets-prod into an egress policy is the most common way to produce a
rule that looks right and matches nothing.
That log is also the only way to tell whether a perimeter edit has landed. An
update
can take up to 30 minutes
to propagate, and meanwhile the perimeter keeps denying requests the new
configuration permits, with the same Request is prohibited by organization's policy a genuinely wrong rule produces. So for the first half hour after a
change, “the rule is wrong” and “the rule has not arrived” are the same
observation, separable only by whether fresh violations keep landing. What
follows is not subtle: someone edits, waits ten minutes, still sees denials, and
edits again on top of the first change.
- title: tool-payments dependency graph
  egressFrom:
    identities:
      - serviceAccount:[email protected]
  egressTo:
    resources:
      - projects/615093478220        # secrets
      - projects/739104582011        # kms
      - projects/274086315927        # request templates in GCS
    operations:
      - serviceName: secretmanager.googleapis.com
        methodSelectors:
          - method: google.cloud.secretmanager.v1.SecretManagerService.AccessSecretVersion
      - serviceName: cloudkms.googleapis.com
        methodSelectors:
          - method: google.cloud.kms.v1.KeyManagementService.Decrypt
      - serviceName: storage.googleapis.com
        methodSelectors:
          - method: google.storage.objects.get
Two of those method names follow the shape you would guess, and Storage doesn’t,
and there is no reliable way to derive google.storage.objects.get from the
client library you called, the REST path or the IAM permission, which makes the
audit log the source of the rule instead of a check on it. Dry-run mode collects
the rest: put the tightened rule in the dry-run configuration, leave the old one
enforcing, wait a day, and every hop you forgot is logged as a would-be block
with the service and method filled in.
The second lesson was about the wrapper. A tool that turns a denial into an empty string hands the model a blank where a failure belongs, and the model will fill it in, so the wrapper now separates the policy surfaces and no denial from any of them can return successfully:
from google.api_core import exceptions as gexc
from google.api_core.retry import AsyncRetry, if_exception_type
from google.cloud import secretmanager_v1
from google.rpc import error_details_pb2
import httpx

_secrets: secretmanager_v1.SecretManagerServiceAsyncClient | None = None

# the caller's timeout is per attempt; the generated retry carries its own
# 60 second deadline, so bounding the call means bounding the retry too
SECRET_CALL = AsyncRetry(predicate=if_exception_type(gexc.ServiceUnavailable),
                         timeout=2.0)


class ToolUnavailable(Exception):
    """Never an empty string. The model must see a failure, not a blank."""


def secrets() -> secretmanager_v1.SecretManagerServiceAsyncClient:
    global _secrets                    # built on first use, inside the loop
    if _secrets is None:
        _secrets = secretmanager_v1.SecretManagerServiceAsyncClient()
    return _secrets


def by_perimeter(err: gexc.PermissionDenied) -> bool:
    return any(v.type == "VPC_SERVICE_CONTROLS"
               for d in err.details
               if isinstance(d, error_details_pb2.PreconditionFailure)
               for v in d.violations)


async def run_tool(tool: str, secret: str, url: str, payload: dict,
                   *, read_only: bool) -> str:
    try:
        got = await secrets().access_secret_version(
            name=secret, timeout=2.0, retry=SECRET_CALL)
    except gexc.PermissionDenied as err:
        surface = "perimeter" if by_perimeter(err) else "iam"
        raise ToolUnavailable(f"{tool}: {surface} denied {secret}: {err}") from err
    except gexc.GoogleAPICallError as err:
        raise ToolUnavailable(f"{tool}: secret fetch failed: {err}") from err
    token = got.payload.data.decode()

    try:
        resp = await call_vendor(tool, url, payload, token)
    except httpx.ProxyError as err:
        # Secure Web Proxy denies the vendor hop on the CONNECT, so there is no
        # response object and no status code on the request itself.
        raise ToolUnavailable(f"{tool}: proxy refused {url}: {err}") from err
    except httpx.HTTPError as err:
        raise ToolUnavailable(f"{tool}: transport failure: {err}") from err

    if resp.status_code >= 400:
        raise ToolUnavailable(f"{tool}: upstream {resp.status_code}")
    await screen_or_decide(resp.text, tool=tool, read_only=read_only)
    return resp.text
PermissionDenied is what a perimeter denial and a missing IAM role both raise,
code 7, from the same library, so the exception type does not say which team to
wake. The discriminator is buried in the status details, where a perimeter denial
carries a google.rpc.PreconditionFailure whose violation type is
VPC_SERVICE_CONTROLS. google-api-core unpacks those onto details only when
grpcio-status is installed; without it details is quietly empty and the check
above never fires.
timeout=2.0 is a per-attempt timeout and not a budget for the call. The
generated client wraps the method in a retry carrying its own sixty-second
deadline, and the timeout decorator sits inside that retry loop rather than
around it, so a secret fetch that keeps meeting ServiceUnavailable re-attempts
for most of a minute while every log line says two seconds. The predicates differ
per product
too: Secret Manager retries ResourceExhausted, so a 429 there is swallowed and
re-sent; Model Armor’s sanitize methods retry only ServiceUnavailable, so a
quota rejection comes straight back; Sensitive Data Protection retries
DeadlineExceeded, so a slow inspect call is re-issued inside the library
against the same per-minute quota you were budgeting against.
And the gRPC clients are built inside the running loop, the opposite of the
advice for httpx further down, because grpc.aio binds a channel to whatever
event loop exists at construction. Built at module scope, it binds to a loop
asyncio.run will never use, and the first call fails complaining about a future
attached to a different loop.
httpx.ProxyError is the one people miss. When a proxy answers a CONNECT with
a non-2xx status, httpcore raises before any request body is written, closes the
connection and discards the response, so there is no Response to inspect and
the status code survives only inside the message string. A denial at the proxy
and one at the perimeter arrive as different exception types from different
libraries, and a wrapper that catches one returns the other as a blank.
Bridges do not chain
The second failure was the opposite shape, in that the perimeter allowed something nobody meant to allow. Two business units each had a perimeter so a tool in one could not read the other’s data, both needed to write to a shared logging project, and someone created one bridge and added both tool projects, both data projects and the shared logging project to it. Perimeter bridges are bidirectional and grant every member equal access within the scope of the bridge, so that made each unit’s tool service account able to read the other unit’s BigQuery datasets. It surfaced in a data-access log review.
What makes the repair non-obvious is the membership rules, and they live in the Access Context Manager reference rather than in the guide you were reading. A project belongs to exactly one regular perimeter and to as many bridges as you want, so the design scales by adding bridges, not by editing the one you have. A bridge carries no access levels and no restricted-services list; the reference requires both to be empty, because they belong to the regular perimeter and only to it. A project cannot join a bridge unless it is already in a regular perimeter, which is the sentence to have read before trying to bridge in a logging project nobody ever put behind one. And a bridge grants access between its members, so a one-member bridge grants nothing. The tooling accepts one without complaint, so a bridge can be tightened until it is off, with no error and nothing in the violation log, because a bridge that grants nothing denies nothing either.
So the shape is one bridge per sharing relationship, two of them here, and the property doing the work is that bridges are not transitive. A project in perimeter A bridged to shared logging and a project in perimeter B bridged to the same logging project still cannot reach each other.
# one bridge per relationship, and project numbers, never ids
gcloud access-context-manager perimeters create tools_a_logging_bridge \
  --policy=POLICY_ID \
  --title="unit A tools to shared logging" \
  --perimeter-type=bridge \
  --resources=projects/482910573648,projects/905517402398

# same again for unit B, then delete the over-broad one rather than shrinking
# it into a duplicate of one of these two
gcloud access-context-manager perimeters delete tools_shared_bridge \
  --policy=POLICY_ID
Two details in there are pure API trivia that will still cost you an afternoon.
The flag is --perimeter-type on create and --type on update, so a command
copied from the creation runbook fails on the fix, and --set-resources replaces
the membership list while --add-resources appends, which matters a great deal
when the mistake you are correcting is that the list is too long.
Two bridges is what we shipped, and the documentation would rather we hadn’t: the overview recommends ingress and egress rules over a bridge for being more granular, and the granularity on offer is direction, since a bridge cannot say that the tool projects write to shared logging and logging never reads back, where a pair of rules can. We kept the bridges anyway, on the grounds that the shared project is a write-only sink, and I am still not sure that was the right trade or only the convenient one, because it would have been plainly wrong the moment that project held anything either unit wanted to read.
Dry-run mode does not help here, and it is worth being precise about why, because “dry-run every perimeter edit” is otherwise good advice. Dry run logs a request only when it violates the dry-run configuration. An over-permissive bridge denies nothing, so it produces no violations, and a clean report is exactly what you would see. Dry run finds the rule you made too tight. Nothing in the perimeter tooling finds the rule you made too loose; that comes out of a data-access log review or not at all.
Getting Model Armor to answer at all
Now the part I set out to write down. The first section said the perimeter has no opinion about third-party APIs, and the documentation for Agent Engine’s managed runtime says that when the project is inside a VPC Service Controls perimeter, the agent’s default internet access is blocked to prevent exfiltration. Both are true, but they are not about the same actor. VPC-SC never evaluates a packet addressed to a vendor; the managed runtime withdraws the egress path it had been giving you for free, because a Google-operated runtime with open internet access inside a customer’s perimeter is an exfiltration route the perimeter cannot see.
The distinction stops being pedantic when you try to fix it, because there is no egress rule to write. You get the path back by building one: a Private Service Connect interface into your VPC, then a proxy and Cloud NAT inside the VPC, which has no outbound path of its own either. Every component that wants to talk outward now costs a reviewed, justified, maintained hole, requested from a network team rather than from whoever owns the perimeter policy. It is why the OAuth token exchange is worth an argument: an agent framework that runs the authorization-code exchange itself has to reach the identity provider’s token endpoint, but a platform that owns the OAuth lifecycle in front of the agent never makes that call cross the boundary.
Google API traffic inside the perimeter normally goes to a Private Service
Connect endpoint for the vpc-sc API bundle, or to the
restricted.googleapis.com VIP, with a private zone for googleapis.com and a
*.googleapis.com CNAME pointing at it, and that wildcard is where Model Armor
breaks. sanitizeUserPrompt and sanitizeModelResponse are served only on Model
Armor’s regional endpoints, modelarmor.REGION.rep.googleapis.com, and Private
Google Access
does not support
endpoints ending in rep.googleapis.com, so the wildcard CNAME swallows the
regional hostname, sends it to a VIP that was never going to serve it, and the
connection dies in the handshake on a certificate subject-name mismatch.
Where that sits in the sequence is what makes it unhelpful, because the name resolved and the route worked, but the failure lands before the first byte of the request, so nothing has consulted IAM, the perimeter, the template, or whether the API is enabled, and all of those misconfigurations present the same way to the caller. Google’s troubleshooting page names the certificate error and a blanket 404 as two symptoms with one remedy. The supported-products page states it as policy rather than as troubleshooting, and that is where I wish I had read it: when Model Armor is restricted within a perimeter, a PSC endpoint is required for it to function.
The DNS side is easy to get subtly wrong. You create a private managed zone and
put an A record at the apex of the real public hostname, so
modelarmor.europe-west4.rep.googleapis.com resolves to the endpoint’s internal
address and the certificate it presents still matches the name the client asked
for. The specific record beats the wildcard, and nothing about the client
changes.
from google.api_core.client_options import ClientOptions
from google.cloud import modelarmor_v1

LOCATION = "europe-west4"
TEMPLATE = f"projects/{PROJECT_ID}/locations/{LOCATION}/templates/boundary-guard"
_armor: modelarmor_v1.ModelArmorAsyncClient | None = None


def armor() -> modelarmor_v1.ModelArmorAsyncClient:
    # gRPC to modelarmor.<region>.rep.googleapis.com:443, resolved by the
    # private zone to the PSC endpoint. Lazily built for the same event-loop
    # reason as the secrets client.
    global _armor
    if _armor is None:
        _armor = modelarmor_v1.ModelArmorAsyncClient(
            client_options=ClientOptions(
                api_endpoint=f"modelarmor.{LOCATION}.rep.googleapis.com"))
    return _armor
Google’s own Python sample passes transport="rest" next to that endpoint
override, and it is worth knowing what that argument does to an async client.
Nothing, at first. There is no rest_asyncio transport, and asking for rest
does not raise. You get the synchronous REST transport, however, and the failure
waits for the first call, which issues a blocking HTTP request from inside the
event loop and then raises a TypeError about awaiting a response object. Floor
settings catch people for the opposite reason: they are served on the global
endpoint, so a console script that reads them succeeds while every sanitize call
from the same machine fails.
The field that says whether the screen ran
With the endpoint fixed the screen answers, and reading the answer turns out to
be a separate problem. SanitizationResult carries filter_match_state and
invocation_result, but almost every integration I have seen reads only the
first.
The reference
defines filter_match_state as having two values: NO_MATCH_FOUND when no
filter in the configuration satisfies its matching criteria, and MATCH_FOUND
when at least one does. A filter that never executed cannot satisfy a matching
criterion. So a screen that failed entirely reports NO_MATCH_FOUND, which is
byte-identical to the answer you get when the content is clean.
invocation_result is the field that separates them. SUCCESS means every
filter ran, PARTIAL means some were skipped or failed, FAILURE means none
ran. Per filter, execution_state carries EXECUTION_SKIPPED and message_items
carries the reason.
Reading those per-filter results has a trap in it that took a deliberate test to
find. filter_results is a map whose values are a oneof over the six filter
arms, so the obvious loop asks which arm is set and reads match_state off it.
Five arms do have a match_state, and the Sensitive Data Protection arm does
not, because SdpFilterResult is itself a oneof, over inspect, de-identify and
redact results, and the states live one level below that. A loop written from
the field list runs clean, raises nothing, and is blind to exactly the filter
whose token budget differs from all the others.
MatchState = modelarmor_v1.FilterMatchState
Invocation = modelarmor_v1.InvocationResult
ExecState = modelarmor_v1.FilterExecutionState


def _leaf(fr: modelarmor_v1.FilterResult):
    # filter_results is a map keyed "rai", "sdp", "pi_and_jailbreak",
    # "malicious_uris", "csam". Each value is a oneof, and the sdp arm is a
    # second oneof, over inspect, deidentify and redact results, which is where
    # match_state and execution_state actually live for that filter.
    arm = fr._pb.WhichOneof("filter_result")
    if arm is None:
        return None
    leaf = getattr(fr, arm)
    if arm == "sdp_filter_result":
        inner = leaf._pb.WhichOneof("result")
        leaf = getattr(leaf, inner) if inner else None
    return leaf


async def screen_response(text: str, *, timeout_s: float = 2.0) -> None:
    resp = await armor().sanitize_model_response(
        request=modelarmor_v1.SanitizeModelResponseRequest(
            name=TEMPLATE,
            model_response_data=modelarmor_v1.DataItem(text=text),
        ),
        timeout=timeout_s,
    )
    result = resp.sanitization_result
    leaves = {name: _leaf(fr) for name, fr in result.filter_results.items()}

    # anything that is not SUCCESS is treated as no verdict, including the
    # unspecified zero value, which is what an omitted field deserializes to
    if result.invocation_result != Invocation.SUCCESS:
        skipped = {name: [m.message for m in leaf.message_items]
                   for name, leaf in leaves.items()
                   if leaf is not None
                   and leaf.execution_state == ExecState.EXECUTION_SKIPPED}
        raise ScreenUnavailable(
            f"invocation_result={Invocation(result.invocation_result).name} "
            f"skipped={skipped}")

    if result.filter_match_state == MatchState.MATCH_FOUND:
        raise BlockedByScreen([name for name, leaf in leaves.items()
                               if leaf is not None
                               and leaf.match_state == MatchState.MATCH_FOUND])
The reason this is not a rare edge case is on the
quotas page, in a table next
to the one about requests per minute. Filters have different token budgets inside
the same request: injection and jailbreak detection, responsible AI and CSAM all
stop at 10,000 tokens, the Sensitive Data Protection filter at 130,000. Past its
limit a filter returns EXECUTION_SKIPPED rather than a verdict.
Model Armor counts a token as four UTF-8 code points excluding whitespace, so on
ordinary English prose the injection filter runs out somewhere around 46 KiB of
retrieved document, which a long wiki page or a support thread with attachments
clears regularly. Above that the SDP filter keeps running, filter_match_state
still says NO_MATCH_FOUND, and the one filter you put in the path specifically
to catch instructions hidden in retrieved text is the one that stood down without
saying so. Chunking is the fix, and it has a cost the last section returns to.
Every inspected tool call spends the quota twice
Model Armor’s default quota is 1,200 queries per minute per project, adjustable between 0 and 1,200 from Cloud Quotas, and above that only by asking Cloud Customer Care. Nobody reads that as a tool-call budget, which is the mistake, because a fully inspected tool call spends two Model Armor invocations, one on the request and one on the response, making the default quota 600 fully inspected tool calls a minute, ten a second, per project, before anything degrades.
Our fleet runs about 500,000 tool calls a day, which averaged over the day is 5.8 a second and looks like enormous headroom. But roughly four fifths land inside a ten-hour business window, which is 11.1 a second, or 1,333 Model Armor queries a minute against a quota of 1,200, so the design did not fit the default quota on a normal Tuesday. Be careful with that 11.1, because I wasn’t at first. It is a mean across ten hours and the quota is enforced against a one-minute bucket, and our busiest minute runs about 1.7x the business-hours mean, so the number to design against is closer to 19 a second and 2,270 queries a minute, and every figure below is computed at the mean and is the optimistic end of the range.
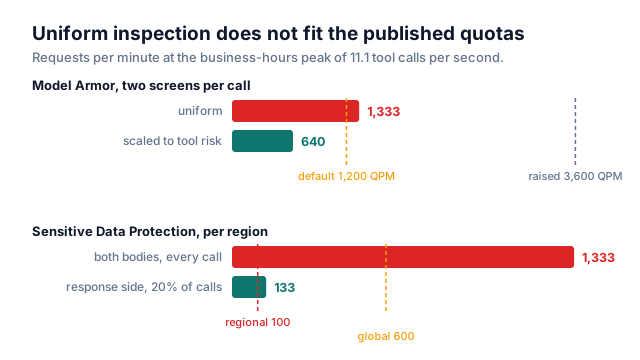
We asked for 3,600 QPM and got it, at a cost of about a week of back-and-forth, and what moved it was a chart of observed QPS against the quota line, the peak we were designing for, and the retry behaviour on rejection. A monthly call volume and a request for capacity produces questions; a rate, a peak-to-mean ratio and a backoff policy produce an approval.
The raised quota bought room for the normal day and not the abnormal one, and a
batch backfill pushed tool traffic to 32 calls a second, which is 3,840 Model
Armor queries a minute against a ceiling of 3,600. Overflow is not gradual: the
API rejects, google-api-core raises ResourceExhausted, and 6.25% of screening
calls were rejected outright. My obvious next step was to say a fully inspected
call makes two screens, so the odds of at least one failing are 1 − 0.9375², or
12.1%, and that is wrong, because a per-minute bucket does not fail
independently. It fills, and everything after it in that minute fails together,
so both screens of a call share a fate and the rate stays near 6.25%, clumped
into the tail of each minute, though against a baseline false-block rate of 0.2%
either number is a large regression. Retries do not soften it either: the bucket
stays full for the rest of the minute, so a schedule starting in the hundreds of
milliseconds spends every attempt inside a window certain to reject it.
In none of those blocks was the screen judging the calls dangerous. The screen was failing to answer at all, and the wrapper was treating no answer as a block, which is a per-tool decision:
import asyncio
import structlog
from google.api_core.exceptions import (DeadlineExceeded, ResourceExhausted,
                                        ServiceUnavailable)

log = structlog.get_logger()
SCREEN_FAILURES = (ScreenUnavailable, ResourceExhausted, DeadlineExceeded,
                   ServiceUnavailable, asyncio.TimeoutError)


async def screen_or_decide(text: str, *, tool: str, read_only: bool) -> None:
    try:
        await screen_response(text)
    except SCREEN_FAILURES as err:
        log.warning("model_armor_unavailable", tool=tool, read_only=read_only,
                    error_type=type(err).__name__, error=str(err))
        if not read_only:
            raise ScreenUnavailable(f"cannot screen {tool}; refusing the write")
        # allowed, and the audit record says it went out unscreened
ResourceExhausted belongs in that tuple. A handler written against
ServiceUnavailable and asyncio.TimeoutError covers the outage you imagined
but misses the quota rejection you get, which is a 429 and a different class.
ScreenUnavailable is in there too, so a PARTIAL invocation gets the same
policy as a transport failure, because it is the same thing: no verdict.
| Mode | On no verdict | Use for |
|---|---|---|
| Fail closed | block the call | write tools, anything moving money or state |
| Fail open with an audit record | allow, log that it was unscreened | read-only tools where an outage should not stop reads |
| Fail open silently | allow, no record | never |
Failing closed on reads means a regional screen outage takes down every read tool
at once, which is a larger incident than the one being guarded against. There is
also an ordering problem underneath that table, and it took a duplicated payment
to see it: the response screen runs once the response exists, which for a write
tool is after the write, so raising ScreenUnavailable there blocks nothing and
merely withholds a result from a model that reads the failure and calls the tool
again. Fail-closed on a write means what the table says only if the screen
that can refuse runs on the request, before call_vendor, and only if the vendor
call carries an idempotency key derived from the tool-call arguments rather than
generated per attempt, so the retry lands on the same charge. Every denial
surface here produces a retryable-looking failure at a different point in the
sequence, but only some of those points are before the side effect.
Sensitive Data Protection has two endpoints and two meters
Sensitive Data Protection is the other half of the inline stack, priced and
quota’d on a completely different axis from Model Armor. It is also, and this
took me far too long to notice, already running inside Model Armor. The sdp
filter is Sensitive Data Protection. Basic configuration screens a fixed short
list of infoTypes with no template involved; advanced configuration takes
inspectTemplate and optionally deidentifyTemplate by resource name, and the
reference is unambiguous about what follows: it performs InspectContent, or
DeidentifyContent when both are set. Not equivalents of them. Those calls, and
under a different principal, the Model Armor service agent, which needs
dlp.user and dlp.reader wherever the templates live.
The consequences arrived in the order we met them. First the regional pinning
chains, because the templates must be in the same location as the Model Armor
endpoint you call, so the private endpoint work from two sections ago also
settles where your DLP templates live. Then the de-identify result turns out to
be a union with the inspect result rather than an addition to it, so configuring
a deidentify template replaces the findings with the redacted text and the
infoType and likelihood detail you were logging stops arriving. And last, we had
the SDP filter on in the Model Armor template and our own deidentify_content
pass over the same body with a different infoType list, which is one control run
twice with two chances to disagree. Google documents neither how the inner DLP
usage is billed nor whether it draws on the same per-project request quota, and I
never got an answer, so we assumed both and turned one of the passes off, which
is a guess I would still like to replace with a number.
The endpoint choice is the next thing the perimeter pushes you toward getting
wrong. The regional endpoints at dlp.REGION.rep.googleapis.com are what you
reach for when data residency is on the requirements list, and the
limits page
prices that choice in throughput: 600 requests per minute per region through the
global endpoint with a location in the parent, 100 per minute against the
regional endpoint directly. Six times less throughput for the same work, on the
endpoint a residency requirement points at. At our business-hours peak,
inspecting both bodies of every tool call is 1,333 DLP requests a minute, which
misses the regional endpoint by a factor of thirteen and the global one by two,
so de-identification came off most calls before anything else was decided. What
survived runs on the global host with the location in the parent, which makes the
residency guarantee one we chose not to have:
from google.cloud import dlp_v2

# dlp() is the same lazy singleton as the clients above, on dlp.googleapis.com
DLP_PARENT = f"projects/{PROJECT_ID}/locations/{LOCATION}"
INFO_TYPES = ("PERSON_NAME", "US_SOCIAL_SECURITY_NUMBER",
              "EMAIL_ADDRESS", "IBAN_CODE")


async def deidentify(text: str) -> tuple[str, int]:
    resp = await dlp().deidentify_content(request={
        "parent": DLP_PARENT,
        "item": {"value": text},
        "inspect_config": {
            "info_types": [{"name": t} for t in INFO_TYPES],
            "min_likelihood": dlp_v2.Likelihood.LIKELY,
        },
        "deidentify_config": {"info_type_transformations": {"transformations": [
            {"primitive_transformation": {"replace_with_info_type_config": {}}}
        ]}},
    }, timeout=2.0)
    return resp.item.value, resp.overview.transformed_bytes
resp.overview.transformed_bytes is the field worth returning even if you throw
it away, because it is the second meter. The
pricing page
bills content.deidentify for inspection at $3.00 per GB over the first free
gigabyte and separately for transformation at $2.00 per GB, and whether the
second applies depends on the primitive: simple redaction, meaning RedactConfig
and ReplaceWithInfoTypeConfig, is not counted against transformed bytes when
infoType inspection is also configured, and anything that preserves format or
reversibility is. Model Armor’s own de-identify result carries a
transformed_bytes field too, which is the strongest hint on offer that it is
the same meter reading the same bytes.
That is a billing decision hiding inside a data-modelling decision. Swapping
replace_with_info_type_config for crypto_replace_ffx_fpe_config, which you do
when the downstream system validates field length, adds the transformation meter
on top of the inspection meter and raised our line by about 13% at a 20% match
rate. Inspection bills the whole payload, transformation only what matched, which
is why the uplift is smaller than the headline rates suggest.
The other floor is per request: a minimum of 1 KB is billed per content inspect or transform, so thirty million requests carrying 300-byte bodies are 9 GB of actual content and 30.7 GB of billed content, $24 a month becoming $89. That scales with request count rather than bytes, so a forecast built from data volume misses it entirely.
The one thing not to do with an outbound de-identify pass is put it in front of a
structured transactional body. Replacing a card number with
[CREDIT_CARD_NUMBER] before posting a charge does not protect the payment, it
breaks it, and the vendor’s 400 will be blamed on the agent. Outbound
de-identification is for free-text payloads. Inbound is different, because what
comes back lands in a context window that gets logged, traced and echoed into an
answer, and that is where our pass lives now.
Trusting a certificate the proxy makes up
The vendor hop goes through Secure Web Proxy in explicit-proxy mode, so the
client points at the gateway’s internal IP on port 443 and issues CONNECT. With
TLS inspection on, the proxy terminates the session and presents a certificate
generated in real time and signed by your private subordinate CA in Certificate
Authority Service. The certificate your client sees is not the vendor’s, and the
CA that signed it is in no public trust store. Google’s TLS inspection overview
puts this under client trust requirements: clients trust the connection only if
your private root CA is pre-installed, which is why the feature is scoped to
hardware you administer. In a Python process, pre-installed means an explicit SSL
context, because httpx defaults to certifi.where() and will not read your
system store for you.
Certificate Authority Service is the piece that never reaches a design review. It
is a hard dependency, and inside a perimeter the dependency recurses. The
supported-products page requires privateca.googleapis.com in the perimeter once
TLS inspection is on, and requires Cloud KMS and Cloud Storage in the perimeter
before CAS works at all, so the control we installed to inspect egress arrived
with its own three-service dependency graph, and with its own meter as well. CAS
charges a monthly fee per certificate authority and a one-time fee per
certificate issued, and TLS inspection mints certificates as traffic arrives.
Google’s instructions then steer you to the DevOps tier because tracking
individually issued certificates is unnecessary, yet that is the tier which
cannot list, describe or revoke them, so the recommended configuration is the one
where the service billing you per certificate will not tell you how many it
issued. The
docs never say whether a certificate is minted per session, per host, or cached,
and from a DevOps pool I couldn’t measure it. Our line item is small, and it is
also what explicit-proxy mode costs, given that next-hop mode gets hostname
allowlisting off the SNI with no TLS inspection, no CA pool and none of the rest.
import ssl
import httpx

SWP = "http://10.24.0.9:443"          # Secure Web Proxy listener, in-perimeter
SWP_CA_BUNDLE = "/etc/ssl/certs/swp-subordinate-ca.pem"

_tls = ssl.create_default_context(cafile=SWP_CA_BUNDLE)
_vendor = httpx.AsyncClient(
    proxy=SWP,
    verify=_tls,
    timeout=httpx.Timeout(8.0, connect=2.0),
    limits=httpx.Limits(max_connections=200, max_keepalive_connections=50,
                        keepalive_expiry=60.0),
)


async def call_vendor(tool: str, url: str, payload: dict, token: str):
    return await _vendor.post(
        url, json=payload,
        headers={"Authorization": f"Bearer {token}", "X-Agent-Tool": tool},
    )
The verify= argument earns a note. Passing it a path string still works in
httpx 0.28 and emits a DeprecationWarning; the supported form is an
ssl.SSLContext, and building one yourself is also how you add the CA without
disabling verification, which is what everyone reaches for at 6pm. This client is
also at module scope, unlike the gRPC ones, because an httpx.AsyncClient per
request means every tool call pays a fresh TCP connection, a proxy CONNECT and
a full TLS handshake against a proxy that is itself handshaking to the vendor,
before a filter has seen anything.
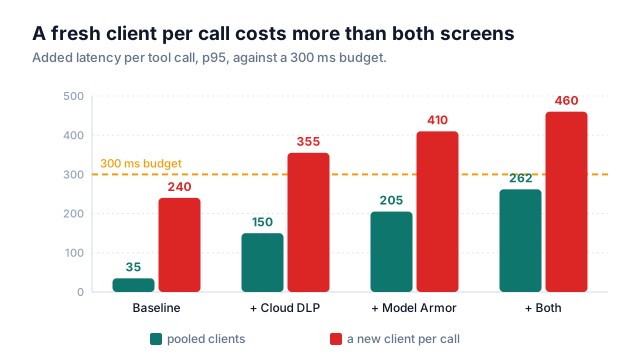
| Config | Pooled p50 | Pooled p95 | Fresh client p50 | Fresh client p95 |
|---|---|---|---|---|
| Baseline (proxy + PSC) | 12 ms | 35 ms | 70 ms | 240 ms |
| + Sensitive Data Protection | 55 ms | 150 ms | 112 ms | 355 ms |
| + Model Armor | 78 ms | 205 ms | 138 ms | 410 ms |
| + Both | 118 ms | 262 ms | 178 ms | 460 ms |
Read the increments, not the totals, and read them across the rows. The two configurations differ only in the vendor hop, so the per-screen increments come out the same in both and the whole penalty sits in the baseline row: unpooled, 240 ms is gone before a filter has looked at anything. The few milliseconds between the two combined increments are run-to-run spread, and so is 227 against the 285 you get by adding the single-screen increments; p95s do not add.
Inspection in proportion to what a tool can do
Latency is the tail problem. Cost and quota are the volume problem, and at 500,000 calls a day they point in the same direction.
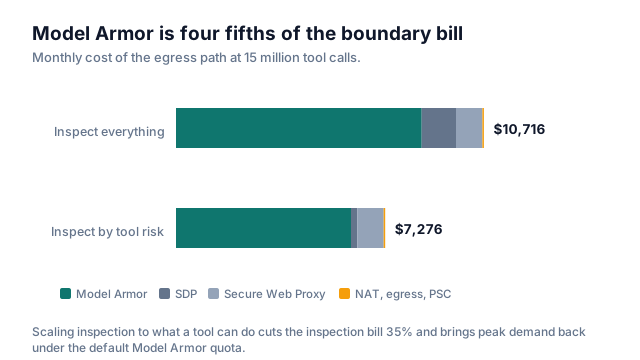
| Component | Monthly | Share |
|---|---|---|
| Model Armor | $8,563 | 80% |
| Sensitive Data Protection | $1,195 | 11% |
| Secure Web Proxy gateway and data | $920 | 9% |
| Cloud NAT, internet egress, PSC endpoints | $38 | under 1% |
| Total | $10,716 | 100% |
That is 0.071 cents a tool call. The network path everybody argues about in the design review is 9% of the bill, and most of that is the flat $1.25 an hour for the gateway rather than anything traffic-dependent. One unit gotcha to keep the arithmetic honest: Secure Web Proxy quotes $0.018 per GB and meters in GiB in the backend, which the pricing page discloses as $0.0193 per GiB. Cloud NAT quotes per GiB from the start. Mixing the two silently costs you 7%.
Model Armor is four fifths of it, and screening is not equally valuable on every hop, so inspection scales with what the tool can do and what data it moves: both directions for write tools and anything touching regulated data, response screen only for read-only tools against governed internal sources, and sampled response screening for read-only tools against public endpoints. That is 35% off the inspection bill on our mix, and it takes peak Model Armor demand from 1,333 queries a minute to 640 and DLP from 1,333 requests a minute to 133.
Those two reductions do not match, and the mismatch is the whole lesson. Model Armor’s quota counts requests, at 1,200 a minute by default, whereas its bill counts tokens, at ten cents a million, where a token is four characters excluding whitespace. The screens we dropped are the tool-argument screens, numerous and tiny; the ones we kept carry retrieved documents, few and enormous. So request volume fell 52% while token volume fell 28%, and the Model Armor line went from $8,563 to $6,199 rather than halving. DLP bills inspected bytes with no per-request component, so its cost tracked its request count almost exactly.
That divergence splits the optimization into two directions that actively fight. To save quota you drop many small screens. To save money you shrink or chunk the few large ones. And chunking a document to fit under the 10,000-token filter limit raises the request count against the quota you were protecting. Nor does 640 a minute leave room for the nightly backfill: at 32 calls a second against an interactive peak of 11.1, the same policy produces about 1,845 a minute.
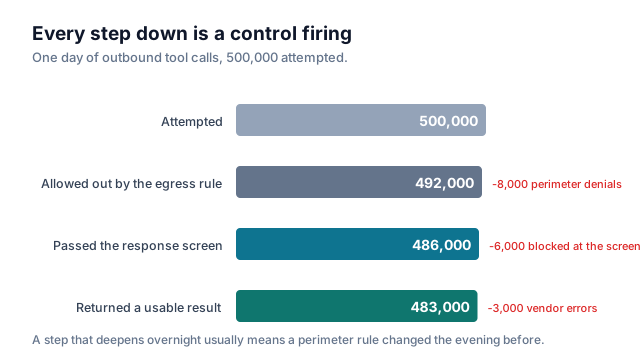
The funnel is a standing dashboard now, because its shape is the fastest way to spot a perimeter misconfiguration: a sudden step down at the egress stage means a rule changed and broke something. When I first drew it, most of that 8,000 was the tightened rule from the first section eating a legitimate tool’s calls while every application-level dashboard stayed green.
What the perimeter is not for
The largest mistake available here is reaching for a network perimeter to solve an application authorization problem. VPC Service Controls stops data reaching the wrong Google project. It has no idea this user may not see that customer’s record, and that check belongs in the tool, against the identity of the human the agent is acting for.
What is specific to agents is narrower than the security framing suggests, and it is one shape repeated. A perimeter denial and a missing IAM role are the same exception. A proxy refusal and a perimeter refusal are different exceptions from different libraries. A screen that never ran and a screen that passed are the same field. A rule that is wrong and a rule that has not propagated are the same error for half an hour. A human disambiguates all four by going and looking somewhere else; a model does not go and look anywhere else, it writes a plausible sentence and carries on. Each of those disambiguations has to happen in the wrapper, in code, before the result is allowed near the model.
The rest is capacity planning. The controls watching the boundary live behind it, with their own endpoints, quotas, service agents and bills, and at least one of ours turned out to be a second copy of another one.